FIGURE 3.
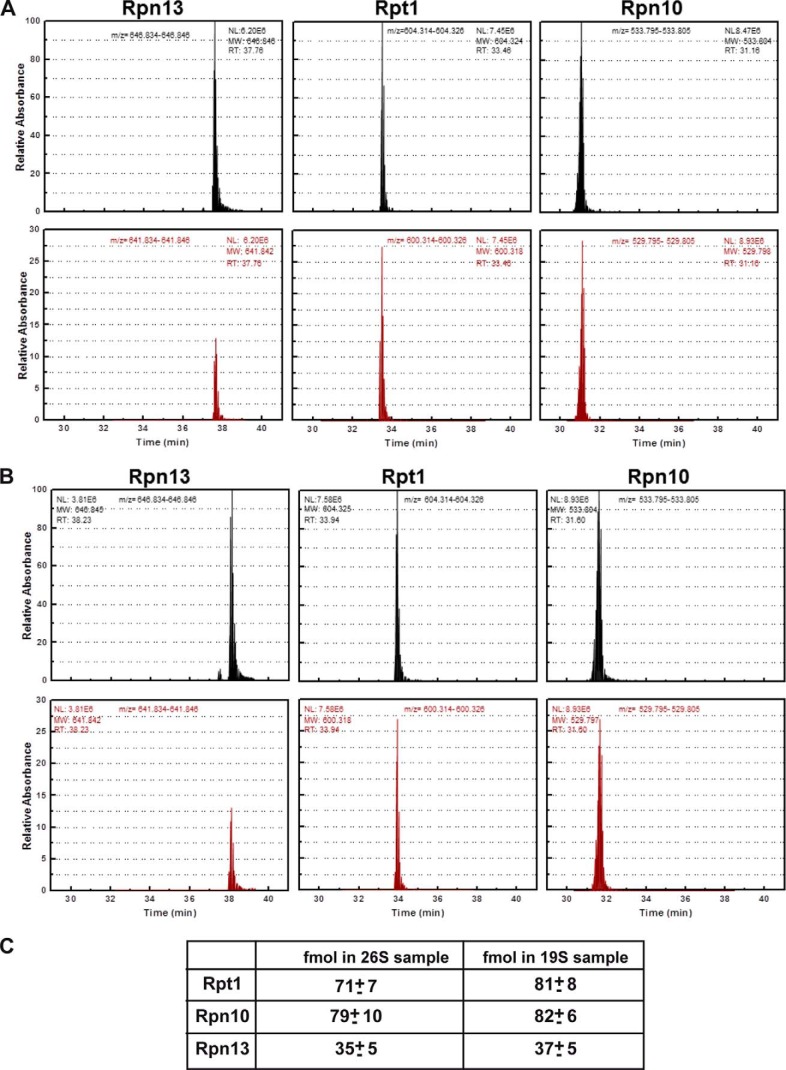
AQUA MS determination of molar ratios of Rpn10 and Rpn13 in yeast 26S and 19S particles. Top plots represent AQUA peptide elution profiles corresponding to 300 fmol peptide of the indicated proteasome subunits. Lower rows represent elution profiles of endogenous proteolytic peptides corresponding to the AQUA peptides detected in the 26S (A) and 19S (B) samples. The 26S and 19S particles were excised from native gels, trypsinized, spiked with 300 fmol of the indicated AQUA peptides, separated on reversed phase chromatography, and analyzed by tandem mass spectrometry. C, amounts in fmol of AQUA peptide corresponding to Rpt1, Rpn10, and Rpn13 illustrating ratios of 2:2:1, respectively. The known concentration of each AQUA peptide was spiked into the mixture of the proteasome tryptic peptides. The peak area of the AQUA peptide and the corresponding sample peptide were calculated using ICIS with mass tolerance of 0.005 Da and the ratio between them was determined. The unknown concentration of the sample protein was calculated using this ratio and the known concentration of the AQUA peptide. The AQUA experiment was repeated least three times with two additional concentrations of the AQUA peptides giving rise to similar results. Note the 1:2:2 ratio of Rpn13/Rpt1/Rpn10 in both the DC 26S proteasomes and the intact 19S complexes.

