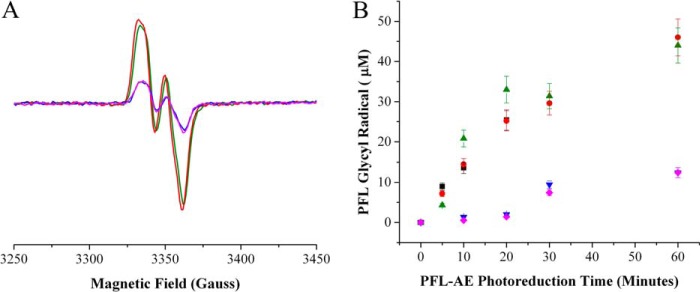
FIGURE 4.

PFL activation by photoreduced PFL-AE in the presence of AdoMet and different PFL substrates. A, EPR data of the PFL glycyl radical in the presence of different PFL substrates after being mixed with PFL-AE photoreduced for 60 min: red, 10 mm oxamate; green, 10 mm pyruvate; blue, 100 μm CoA; and magenta, no substrate. B, the graph shows the quantity of glycyl radical formed on PFL after mixing with PFL-AE that had been photoreduced for 0–60 min; after mixing, the samples were analyzed using EPR. Colors are the same as in A with the addition of a PFL-AE standard in black, which was spin quantified for [4Fe-4S]1+ using a CuII(EDTA) standard. PFL was spin quantified using a K2(SO3)2NO standard. Samples containing 50 μm PFL-AE and 50 μm 5-deazariboflavin in 20 mm HEPES, 250 NaCl, pH 7.4, were photoreduced for 0, 10, 20, 30, and 60 min. 50 μm PFL dimer with either pyruvate, oxamate, CoA, or no substrate was added, and the samples were incubated in the dark for an additional 20 min before being frozen in liquid N2 and analyzed by EPR. Glycyl radical signals were measured at 60 K and the [4Fe-4S]1+ cluster signals were measured at 12 K to ensure that there would be no overlapping signals. EPR parameters were as follows: microwave frequency, 9.37 GHz; power, 19 milliwatt; modulation amplitude, 5 G.
