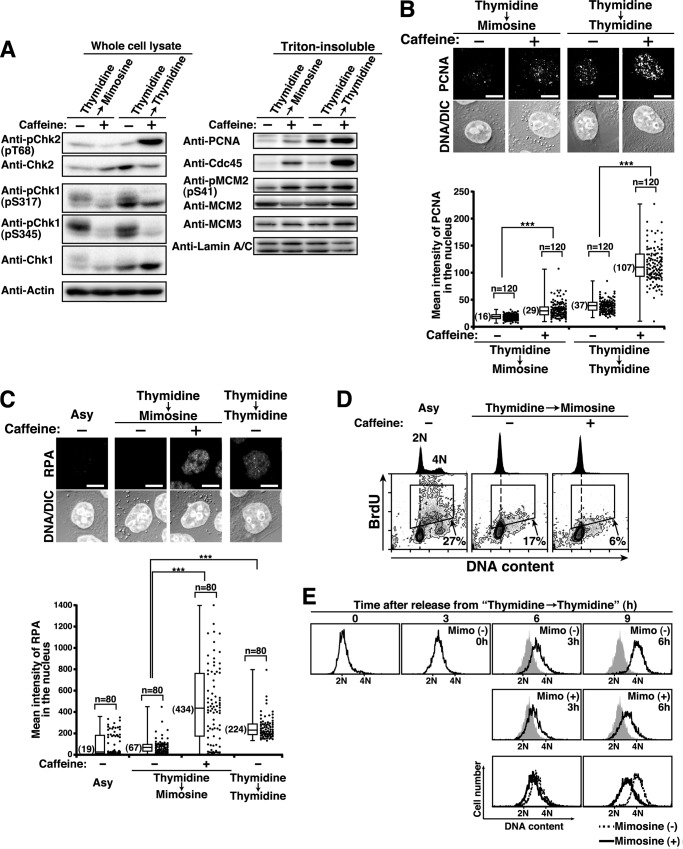
FIGURE 6.
Inhibition of S phase entry by mimosine-activated cell cycle checkpoint signaling. A–D, HeLa S3 cells were synchronized by the indicated methods in the presence or absence of 10 mm caffeine during the last 3 h. A, cell lysates were analyzed by Western blotting. B and C, the Triton-resistant fraction was fixed and stained for DNA and PCNA (B) or RPA (C). Bottom panels, mean fluorescence intensities of PCNA (B) or RPA (C) immunostaining in the nucleus were measured. ***, p < 0.001, calculated by Student's t test. Scale bars = 10 μm. Asy, asynchronous cells; DIC, differential interference contrast. D, cells were pulse-labeled with BrdU during the last 30 min and analyzed by flow cytometry. BrdU levels (y axis) are plotted against DNA content (x axis), and BrdU-positive cells (boxed areas) are shown as percentages. DNA histograms are shown at the top. E, S phase cells prepared by 3-h release from Thy → Thy synchronization were further incubated in the presence or absence of 1 mm mimosine for the indicated times. Shaded histograms represent DNA content of cells released for 3 h from Thy → Thy synchronization. Bottom panels, overlay histograms of cells incubated in the presence (solid line) and absence (dotted line) of 1 mm mimosine.

