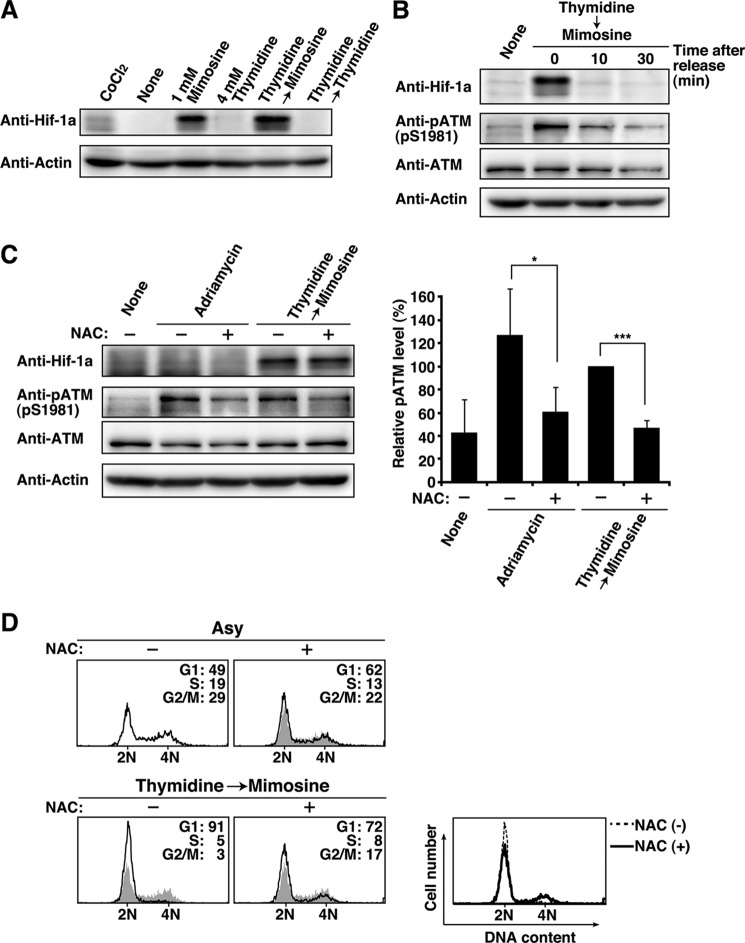
FIGURE 8.
ATM activation through ROS-mediated hypoxic stress. A, HeLa S3 cells treated with 150 μm CoCl2 for 24 h (positive control) or cells synchronized by the indicated methods were analyzed by Western blotting. B, Thy → Mimo-synchronized cells released for the indicated times were analyzed by Western blotting. C, cells treated with 100 ng/ml Adriamycin for 1 h in the presence or absence of 50 mm NAC and cells synchronized by treatment with Thy → Mimo in the presence or absence of 50 mm NAC during mimosine treatment were analyzed by Western blotting. The results (percent) represent the mean ± S.D. from four independent experiments. *, p < 0.05; ***, p < 0.001; calculated by Student's t test. D, cells were analyzed for DNA content by flow cytometry. Shaded histograms represent DNA content of asynchronous cells. Right panel, overlay histogram of cells synchronized by Thy → Mimo in the presence (solid line) and absence (dotted line) of NAC during mimosine treatment. Asy, asynchronous cells.

