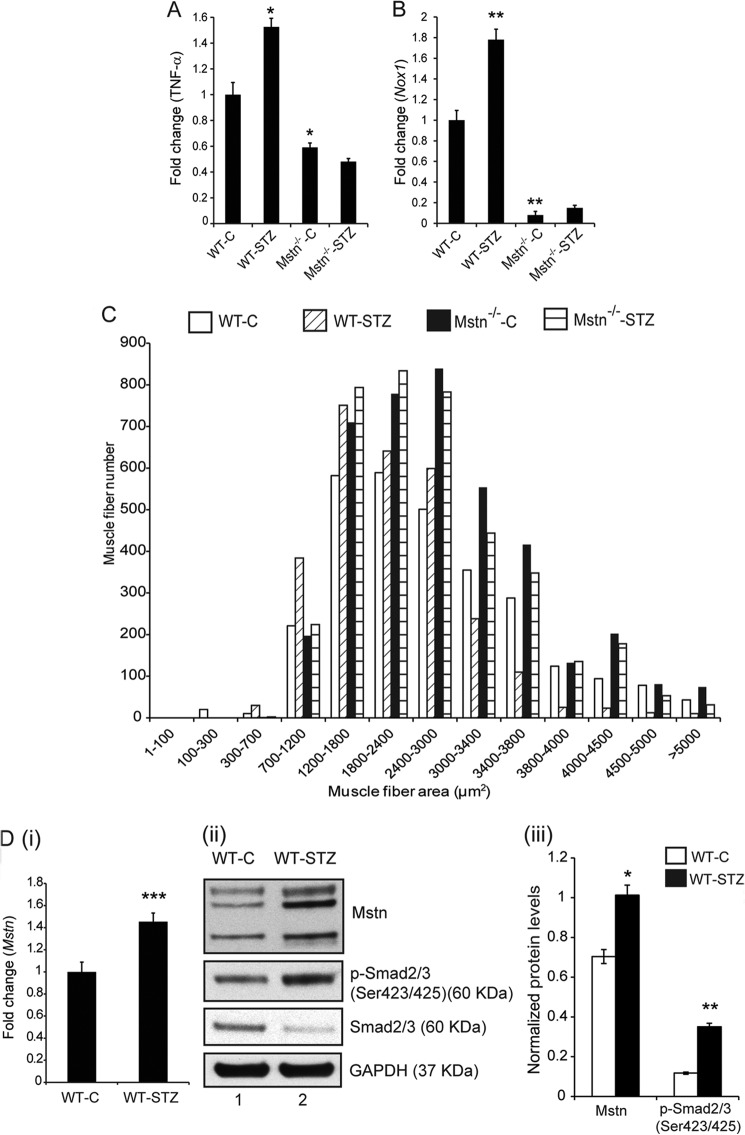
FIGURE 1.
STZ treatment induced skeletal muscle atrophy in mice. Representative graph showing mRNA expression of TNF-α (A) and Nox1 (B) in Gastrocnemius muscle from C and STZ groups of WT and Mstn−/− mice (Day 7), (*, p < 0.05 and **, p < 0.01 when compared with WT-C muscle, n = 7). C, representative graph showing frequency distribution of Tibialis anterior skeletal muscle fiber cross-sectional area (μm2) in WT-C, WT-STZ, Mstn−/−-C and Mstn−/−-STZ mice (n = 7). D, representative graph (i) showing mRNA expression of Mstn and representative Western blot (ii) and densitometric analysis (iii) showing protein levels of Mstn, p-Smad2/3 and Smad2/3 in WT-C and WT-STZ Gastrocnemius muscle (n = 7, *, p < 0.05; **, p < 0.01; ***, p < 0.001; lane 1-WT-C, lane 2-WT-STZ). GAPDH was used as an internal control for equal protein loading on the gel.

