
FIGURE 7.
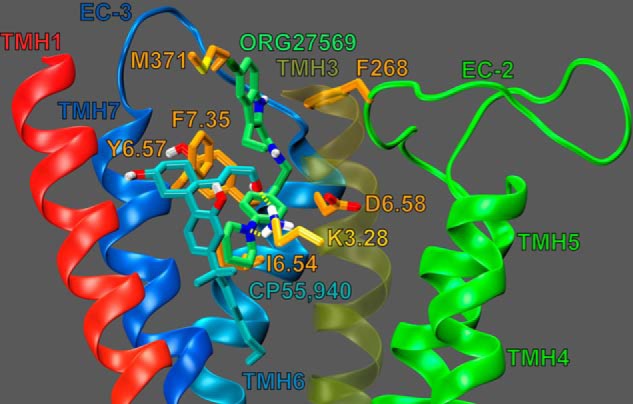
Dock of ORG27569 (lime green) at the CP55,940 (cyan)-CB1R** complex. The view is from the lipid bilayer looking toward TMH3. TMH2 and the EC-1 loop have been omitted for clarity. Residues that contribute ≥5.5% of ORG27569's total interaction energy are shown in orange. K3.28192 contributes 11.09% of ORG27569's total interaction energy and is shown in bright orange; K3.28192 is shown forming a hydrogen bond (yellow dashes) with both ORG27569 and CP55,940.