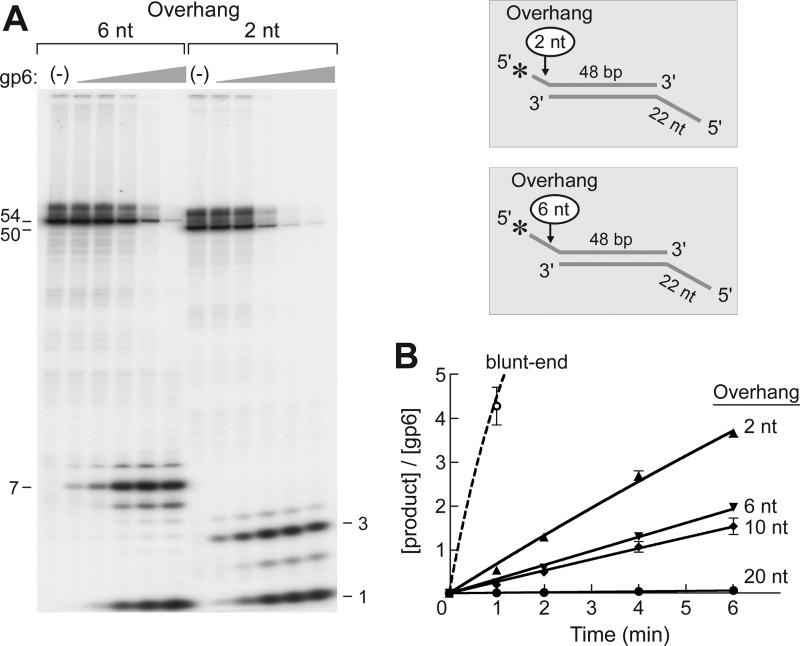
FIGURE 3.
Effect of the length of the 5′-overhang on flap endonuclease activity. A, the efficiency of flap endonuclease activity of gp6 on substrate having a 2-nt (A2:B1) or 6-nt (A3:B1) 5′-overhang was examined using the DNA substrates shown in the inset. The structures of the two substrates are identical to that of Substrate B shown in Fig. 2 except that the lengths of the 5′-overhang are either 2 or 6 nt. The 5′-terminus of the overhang was labeled with 32P. A 5′-ssDNA tail (22 nt) was also present at the other end of the duplex to prevent the degradation of the duplex portion of the substrate by the strong gp6 exonuclease activity. Reactions (20 μl) were carried out by incubating increasing concentrations of gp6 (0.8, 4, 20, 100, and 500 nm) with the indicated substrates (50 nm) at 37 °C for 10 min. The reaction products were separated on an 18% polyacrylamide gel containing 7 m urea and analyzed using a PhosphorImager. Closed arrowheads represent the products that are cleaved by the endonuclease activity of gp6 at one nucleotide into the duplex DNA. The numbers shown on the left of the autoradiograph indicate the size of the denatured intact labeled strands of the two substrates. B, the effect of different lengths of the 5′-overhang on gp6 endonuclease activity. The products generated by flap endonuclease activity of gp6 were measured on DNA substrates bearing different 5′-overhang length (0, 2, 6, 10, and 20 nt). The mononucleotide product was not included in the measurement in order to compare only the endonuclease activity. The 5′-termini of the overhangs were labeled with 32P, and a 22-nt 5′-overhang was present on the complementary strand to decrease the activity of the gp6 exonuclease activity on the 48-bp duplex region. Reactions were initiated by incubating gp6 (100 nm for the 20-nt overhang and 50 nm for the others) with substrates at 37 °C. The reaction products at the indicated time point were separated on a 20% polyacrylamide gel containing 7 m urea and analyzed using a PhosphorImager. In order to compare the rate of hydrolysis for each substrate, the product concentrations were normalized to the gp6 concentration needed to detect the product. The solid lines represent 5′-overhang substrates (A2–A5:B1), and the dashed line represents the blunt-ended substrate (A1:B1). Plots represent the mean, and error bars indicate S.D. from three independent experiments.

