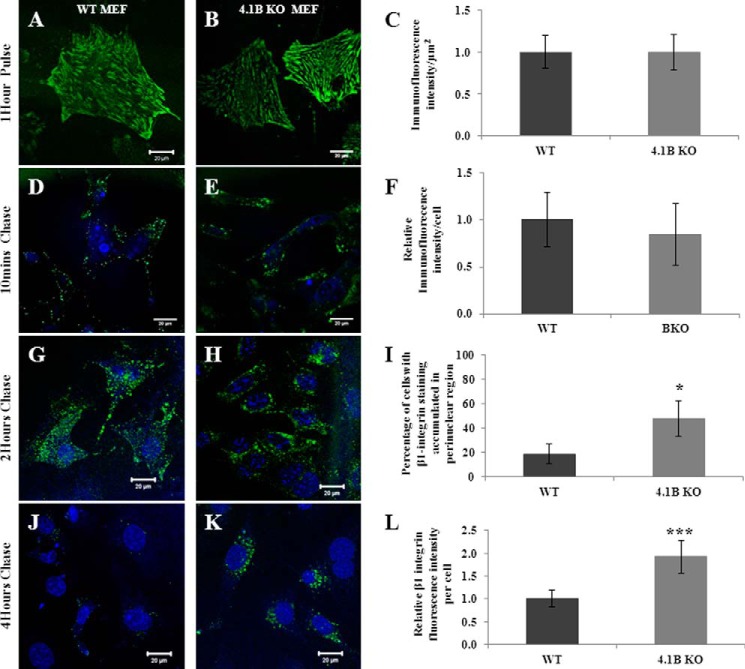
FIGURE 7.
Impaired β1 integrin trafficking in 130-kDa 4.1B-deficient MEF cells. A–C, pulse phase. MEF cells were pulse-labeled with 9EG7 monoclonal antibody for 1 h at 4 °C. Quantitative analysis was from 50 cells of each type. D–F, the internalized β1 integrin after 10 min chase. After a 10-min chase, the cells were quenched, and internalized β1 integrin were visualized. Quantitative analysis was from 50 cells of each type. G–I, the internalized β1 integrin after 2 h chase. After a 2-h chase, the cells were quenched, and internalized β1 integrin were visualized. Quantitative analysis was from 50 cells of each type. *, p < 0.05. J–L, the internalized β1 integrin after 4 h chase. Cells were treated with same procedures after a 4-h chase as described above. The fluorescence intensity of the cells (50 cells of each type) were measured and quantified using Image J. ***, p < 0.001. All pictures were taken with a 25× objective. Scale bars, 20 μm. Note that a single exposure setting was used for all fluorescence quantifications.

