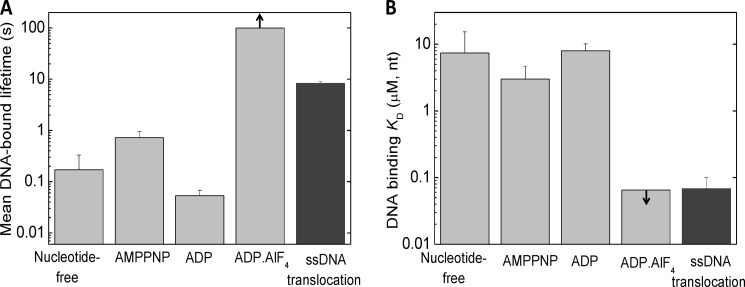
FIGURE 6.
Comparison of DNA binding parameters of RecQ in different nucleotide states with those during ATP hydrolysis-driven ssDNA translocation. A, mean DNA-bound lifetime of RecQ in different nucleotide states (determined in this study), compared with that determined during ATP hydrolysis-driven ssDNA translocation (12) in identical physicochemical conditions. The mean DNA-bound lifetime of RecQ in a given nucleotide (N) state (〈τ〉) was calculated as 〈τ〉 = α1(1/k−1) + α2(1/k−2), where α1 and α2 are the fractional occupancies of the RecQ†.(N.)DNA and RecQ††.(N.)DNA states within the DNA-bound enzyme population, respectively (α1 = 1/(K2 + 1); α2 = K2/(K2 + 1); cf. Fig. 1G and Table 1). B, DNA-binding overall Kd (Keq) values of RecQ in different nucleotide states (cf. Table 1), compared with the apparent DNA binding Kd (Kd,app) values determined in steady-state ATPase experiments in identical physicochemical conditions (cf. Table 3). Arrows in the ADP-AlF4 columns indicate that only a lower bound for the DNA-bound lifetime (A) and an upper bound for the DNA-binding Kd (B) could be defined for this state. Error bars, S.E.

