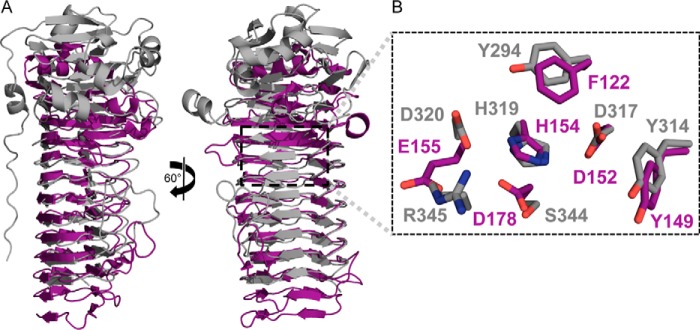
FIGURE 6.

AlgG and AlgE4 superimposition. A, schematic representation of AlgG (gray) and AlgE4 (purple). AlgG and AlgE4 were structurally aligned according to their respective active sites. B, a detailed view of the superimposed active site residues of AlgG (gray) and AlgE4 (purple) are shown in stick representation.
