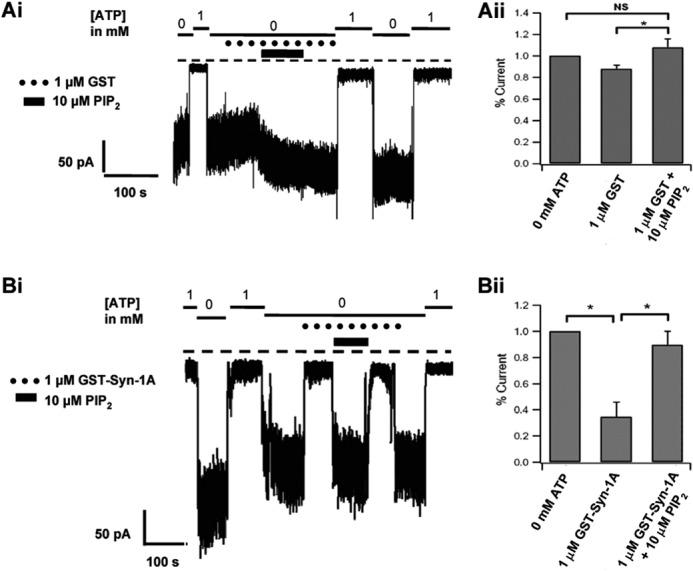
FIGURE 3.

Inside-out patch recording of INS-1 cells showing PIP2 activation KATP currents exceeds PIP2-mediated recovery of Syn-1A inhibition of KATP currents. Representative KATP current tracings of 1 μm GST with 10 μm PIP2 (Ai) and 1 μm GST-Syn-1A with 10 μm PIP2 (Bi) and their respective summary data (Aii and Bii; n = 5 cells each) of the maximum current (in 0 mm ATP Kint solution). Here, membrane patches were initially exposed to 0 and 1 mm ATP Kint solution. Results are mean ± S.E. (error bars); *, p < 0.05; NS, not significant.
