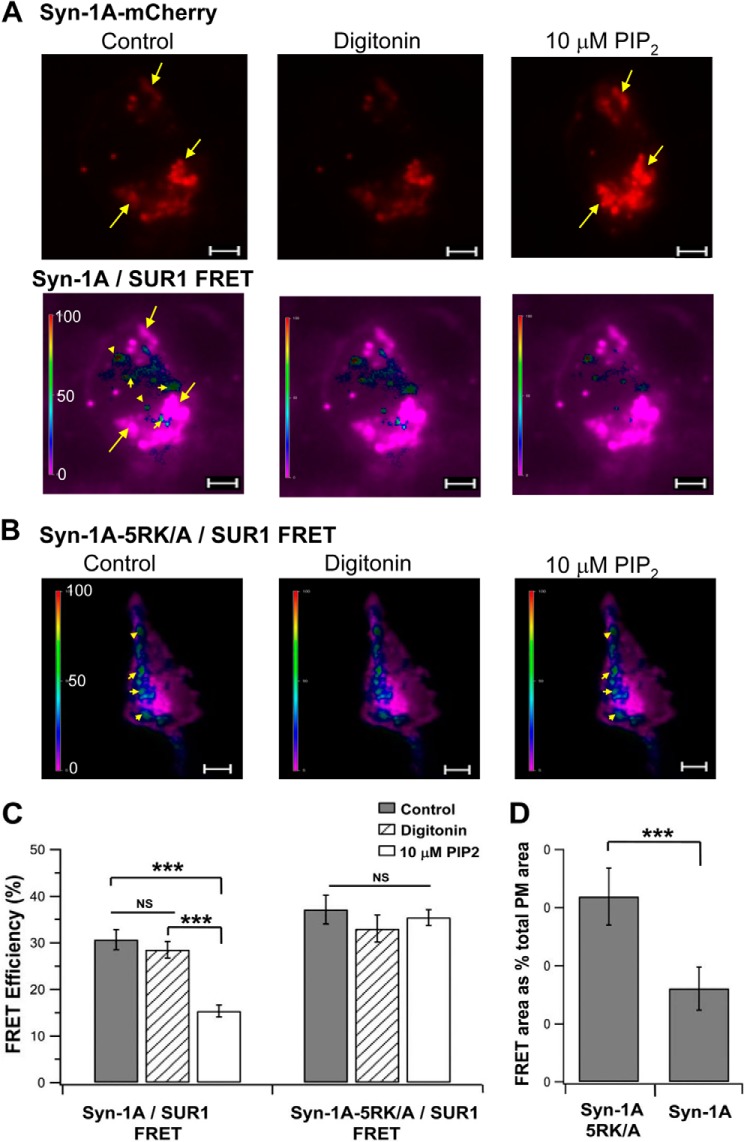
FIGURE 5.
In vivo TIRFM FRET imaging showing that PIP2 disrupts Syn-1A WT but not PIP2-insensitive Syn-1A-5RK/A binding to SUR1. Shown in A and B are representative recordings of FRET signals on the PM (indicated by different pseudocolors) of HEK cell expressing WT-Syn-1A-mCherry (A) or Syn-1A-5RK/A-mCherry (B), SUR1-EGFP, and Kir6.2 prior to (control) and after the addition of 10 μm PIP2 to the permeabilized cells. In A, the Syn-1A-mCherry fluorescent images are also shown (top images). Arrows in A, Syn-1A-mCherry hotspots; arrowheads in A and B, FRET hotspots. Scale bar, 5 μm. A vertical scale bar indicates FRET efficiency in pseudocolor. C, summary of FRET efficiency represented by images in A (n = 17) and B (n = 13). D, percentage of FRET fluorescent area on PM as a percentage of total PM area under control conditions (n = 13). Results are mean ± S.E. (error bars); ***, p < 0.001; NS, not significant.

