FIGURE 7.
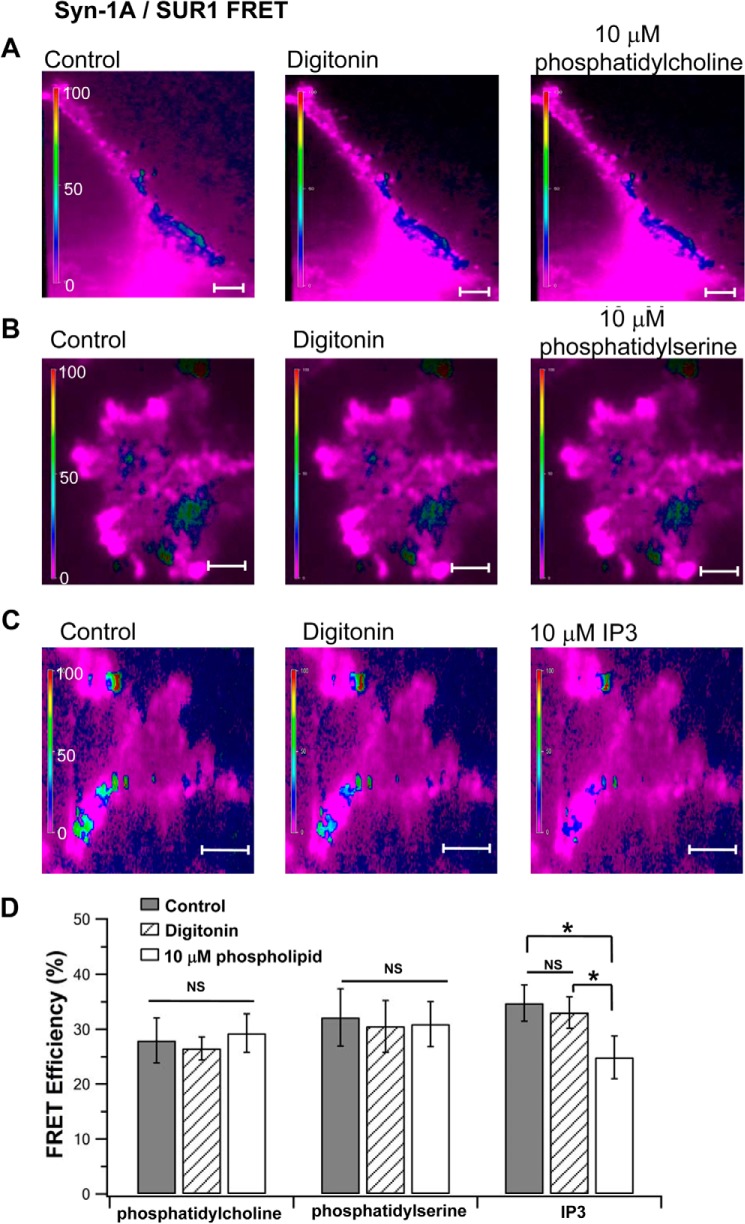
In vivo FRET TIRFM imaging showing other phospholipids had little or no effect on Syn-1A·SUR1 complexes. 10 μm phosphatidylcholine (A), phosphatidyl-l-serine (B), and IP3 (C) were added to digitonin-permeabilized HEK cells expressing WT-Syn-1A-mCherry and SUR1-EGFP (as in Fig. 5). Shown are representative cells for each condition. D, summary of FRET efficiency (mean ± S.E. (error bars)) of A (n = 14), B (n = 13), and C (n = 15). *, p < 0.01; NS, not significant.

