FIGURE 9.
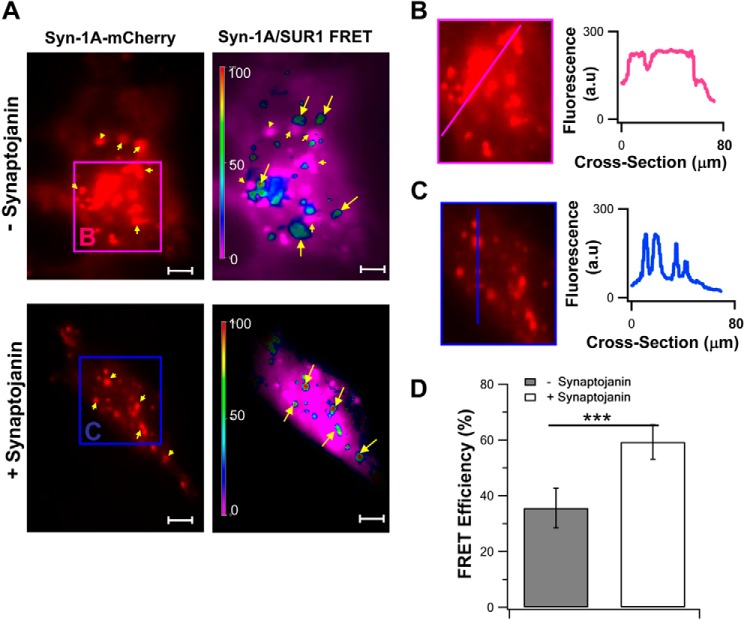
TIRFM FRET imaging showing that PIP2 depletion from PM disperses Syn-1A clusters, releasing Syn-1A to form complexes with SUR1. A, representative image recordings of Syn-1A-mCherry and corresponding FRET signals on the PM (indicated by different pseudocolors) of HEK293 cells expressing Syn-1A-mCherry, SUR1-EGFP, and Kir6.2. The top images show that Syn-1A-mCherry (indicated by arrowheads) clustered in microdomains (region B; pink box). Synaptojanin-1 expression to reduce endogenous PIP2 levels (bottom images in A) dispersed Syn-1A clusters into smaller Syn-1A-mCherry hotspots (region C; blue box). B and C, magnifications of the indicated regions in (A), wherein we analyzed the intensity profile of the cross-sections along the pink and blue lines, shown in the graphs on the right. D, summary of FRET efficiency represented by images in A (mean ± S.E. (error bars), n = 14 cells for each group; ***, p < 0.001).

