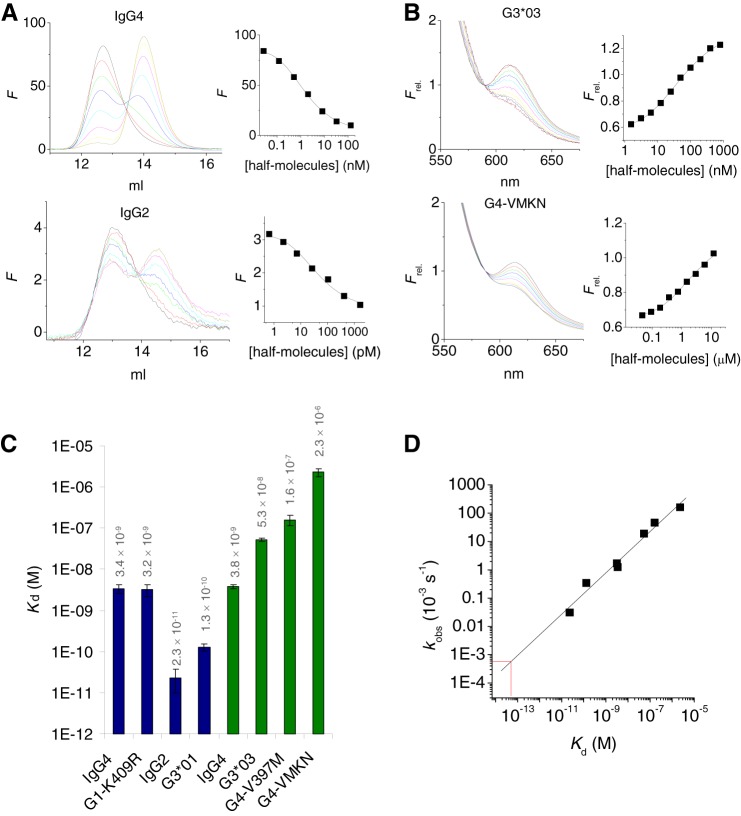
FIGURE 3.
Strength of CH3-CH3 interactions. A, a small, fixed dose of DyLight488-labeled antibody (1 and 0.05 ng/ml for IgG4 and IgG2, respectively) was incubated with different concentrations of unlabeled antibody at 37 °C in the presence of DTT, and samples are analyzed by high performance-size exclusion chromatography (left panels). Right panels, fluorescence at 14.5 ml (representing dissociated half-molecules) was plotted versus the total concentration of half-molecules. The solid line represents a fit of a 1:1 dissociation model to the data. B, equimolar amounts of DyLight488 and DyLight594-lableled Fc fragments are incubated at various concentrations in the presence of DTT and fluorescence spectra recorded. Right panels, fluorescence at 620 nm (FRET signal; relative to the fluorescence at 588 nm, the isosbestic point; Ref. 4) plotted versus the total concentration of half-molecules. The solid line represents a fit of a 1:1 dissociation model to the data. C, dissociation constants as determined by HPLC (blue bars) or FRET (green bars). For IgG4, both methods yielded an essentially equal Kd. D, observed rate constants (Fig. 2C) representing the dissociation reaction correlate well with the dissociation constants Kd (r2 = 0.98, slope 0.73). Red lines indicate the estimate of the Kd for IgG1 based on the dissociation rate constant.

