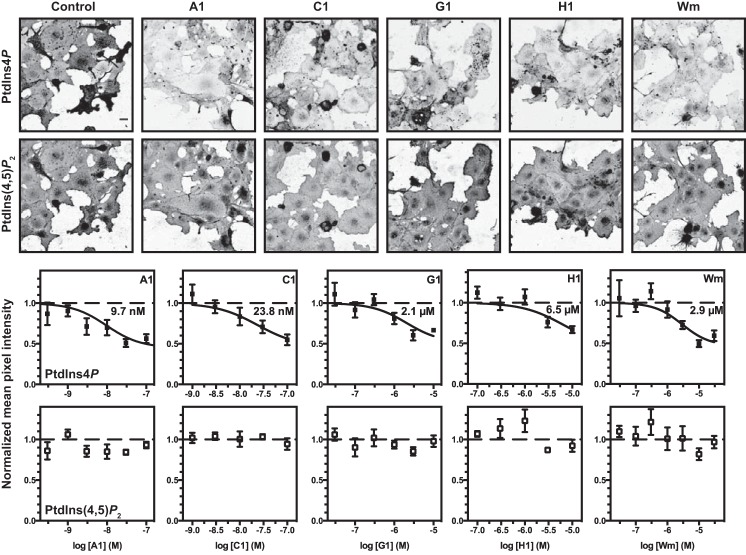
FIGURE 6.
Effect of selected PI4KA inhibitors on plasma membrane PtdIns(4)P and PtdIns(4,5)P2 levels measured in fixed and immunostained COS-7 cells. Representative images of COS-7 cells treated for 10 min with 100 nm A1, 100 nm C1, 10 μm G1, 10 μm H1 or 30 μm Wm, as indicated, and then fixed and stained for PtdIns(4)P and PtdIns(4,5)P2. Graphs show the mean pixel intensity (normalized to vehicle controls) for the indicated concentration of each compound. The fitted IC50 value is indicated on each graph. Data are grand means ± S.E. of 4–5 independent experiments. The bar indicates 20 μm.

