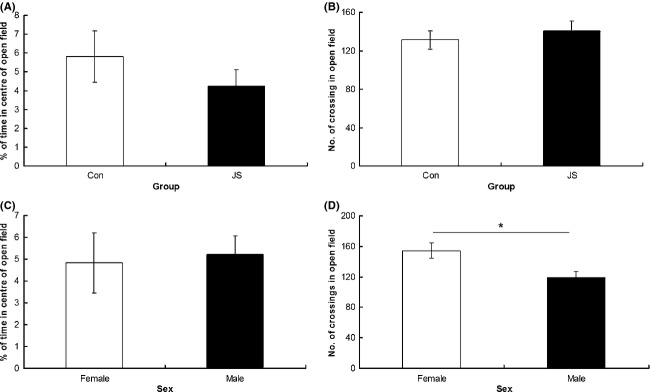
Figure 2.

Open field test. (A) Percentage of time spent in the center of the open field maze and (B) number of crossings made in the open field by control (Con) and juvenile stress (JS) animals. (C) Percentage of time spent in the center of the open field maze and (D) number of crossings made in the open field by female and male animals. Error bars represent 1 SE, bars connected by an asterisk are significantly different to one another. (*P < 0.05, **P < 0.01, ***P < 0.001).
