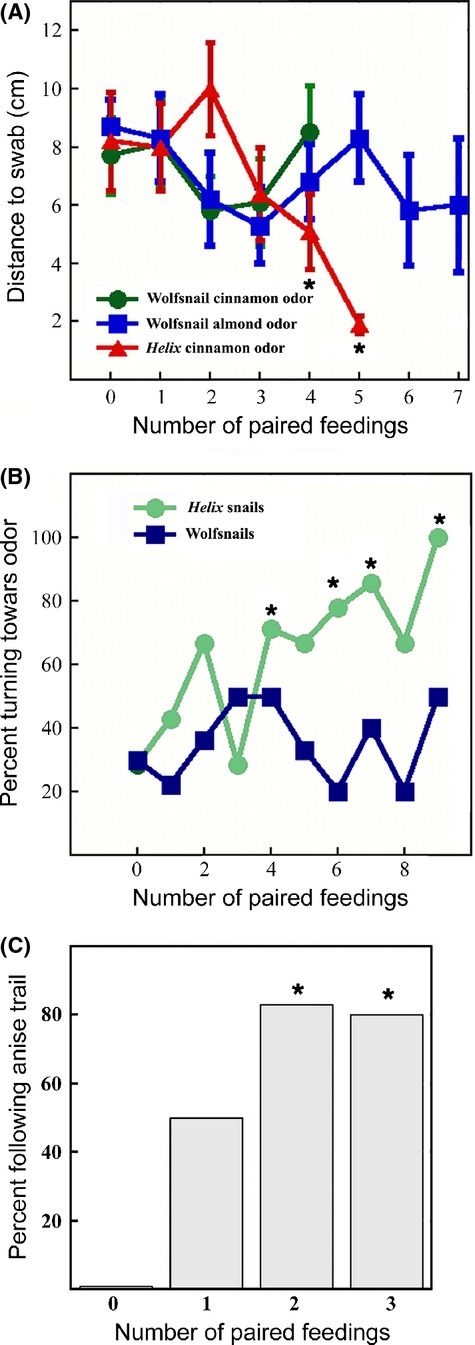
Figure 8.

Euglandina appear capable of minimal olfactory learning compared to Cantareus snails. The 0 time points represent baseline trials in which the snails had no prior exposure to the odorant. (A) Results from conditioning experiment where the distance from snail trail to an odorant-soaked swab was measured at the closest point. Seven Euglandina were tested for learning for each of two different odors, while seven Cantareus were tested on a single odor. Data are means ± SEM. Significance was tested by ANOVA. Points at which the average distance to the swab was significantly different than the baseline at the P < 0.05 level are indicated with *. (B) Percent of snails turning toward odor on a swab was measured with nine Cantareus snails and 10 Euglandina. Significance was tested with a logistic regression. For the significant data points (indicated by *) the following values were obtained: four paired feedings χ2 = 4.22, P = 0.040; six paired feedings χ2 = 5.12, P = 0.023; seven paired feedings χ2 = 4.89, P = 0.027; nine paired feedings χ2 = 4.24, P = 0.039. (C) Seven Euglandina were tested for following of an artificial trail of an odorant (bay oil). The 0 time point represents baseline with no prior exposure to bay oil. Significance was tested with logistic regression, and is indicated with *. For the significant data points, the following values were obtained: two paired feedings χ2 = 4.77, P = 0.029; three paired feedings χ2 = 4.98, P = 0.026.
