
Figure 1.
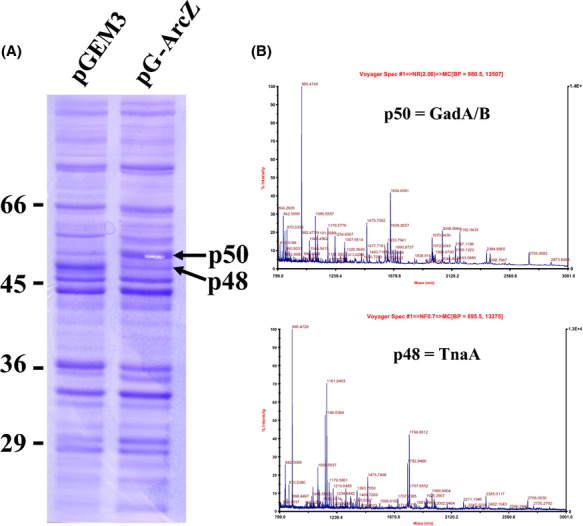
Protein expression profile of ArcZ overexpressing cells. (A) Equal amounts of total protein from Escherichia coli MG1655 cells containing pG-ArcZ and the pGEM3 vector, respectively, were subjected to electrophoresis on a 10% acrylamide SDS gel and compared. Increased or decreased protein bands are indicated with arrows. (B) Protein bands were excised and identified using Q-TOF2 MS/MS. As peptides containing the N-terminal end regions of p50 were not detected by Q-TOF MS/MS, GadA and GadB were indistinguishable so that p50 was assigned to GadA or GadB (GadA/GadB).