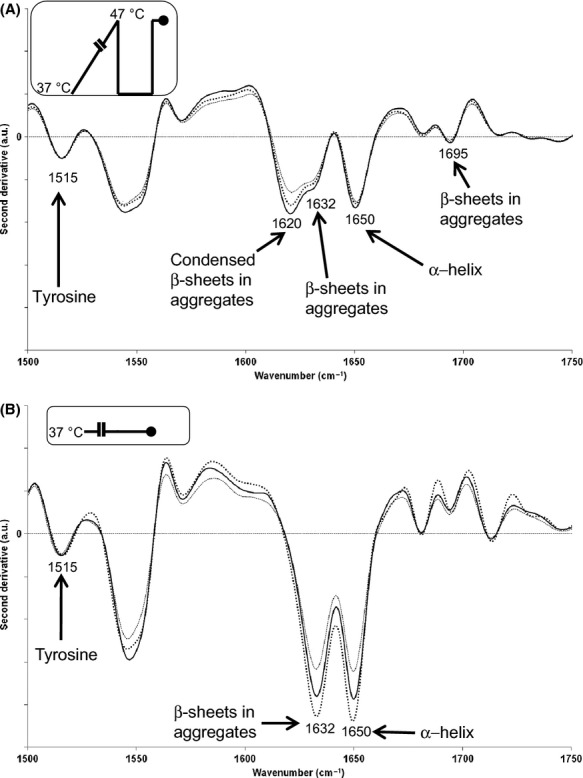
Figure 4.

Spectroscopic analysis of protein aggregation in slowly warmed and heat-treated bacterial cells of E. coli DPD3084. Secondary protein structure was analyzed with Fourier transform infrared spectroscopy (FTIR) Second-derivative spectra were normalized against the tyrosine band (around 1515 cm−1) in the range of 1500–1750 cm−1. Second-derivative spectra of (A) slowly warmed cells (repetitions 6–8), and (B) the corresponding control cells were obtained using raw spectra measured at 47 and at 37°C, respectively, after a centrifugation step at 37°C for 15 min. In (A) and (B), the numbers represent wavenumbers (in cm−1) and the corresponding chemical functions are indicated with arrows. Insets represent the temperature variations as a function of time, where the black circles indicate measurements.
