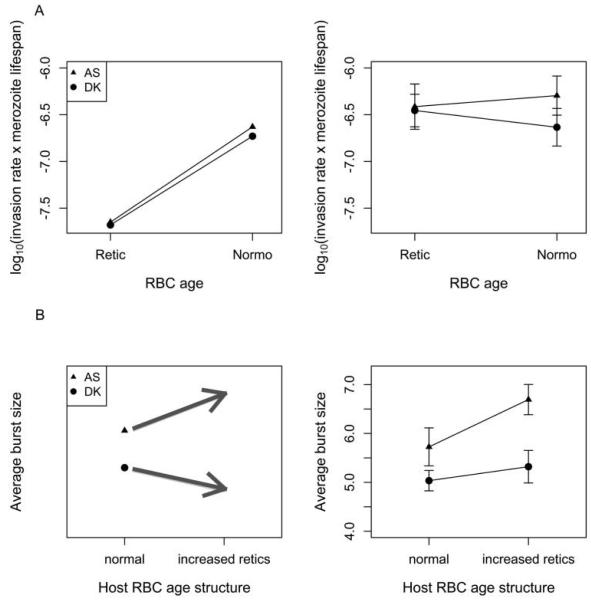
Figure 2. Predictions from the model of Mideo et al. (2008b; left) and experimental data (right) for invasion rates (A) and burst sizes (B).
A, left, The invasion rate of reticulocytes (Retic) is predicted to be similar for both parasite genotypes and much lower than for mature red blood cells (RBCs; Normo). The more virulent genotype (AS, triangles) is predicted to have a higher invasion rate of mature RBCs than the less virulent genotype (DK, circles). A, right, We find little support for our predictions. While invasion rates of both genotypes are similar in reticulocytes, they are an order of magnitude higher than expected, and higher invasion rates in mature RBCs across genotypes were not observed. Means of log10-transformed invasion rate estimates × merozoite life span (assumed to be 30 min) are presented from four or five individual infections. Values along the Y-axis have units of cells per microliter. B, left, Burst sizes are predicted to be higher for AS (more virulent) than for DK (less virulent). The model predicts that AS has a higher burst size in reticulocytes than in mature RBCs, so the average burst size in AS infections should increase when the proportion of infected RBCs that are reticulocytes is experimentally increased in a subset of hosts, while the opposite is predicted for DK. B, right, As predicted, AS had a higher burst size in control infections, but increasing the proportion of reticulocytes did not result in the predicted changes. Means are calculated from average burst sizes in four or five individual infections from each treatment. Error bars = ±1 SEM.

