Fig. 8.
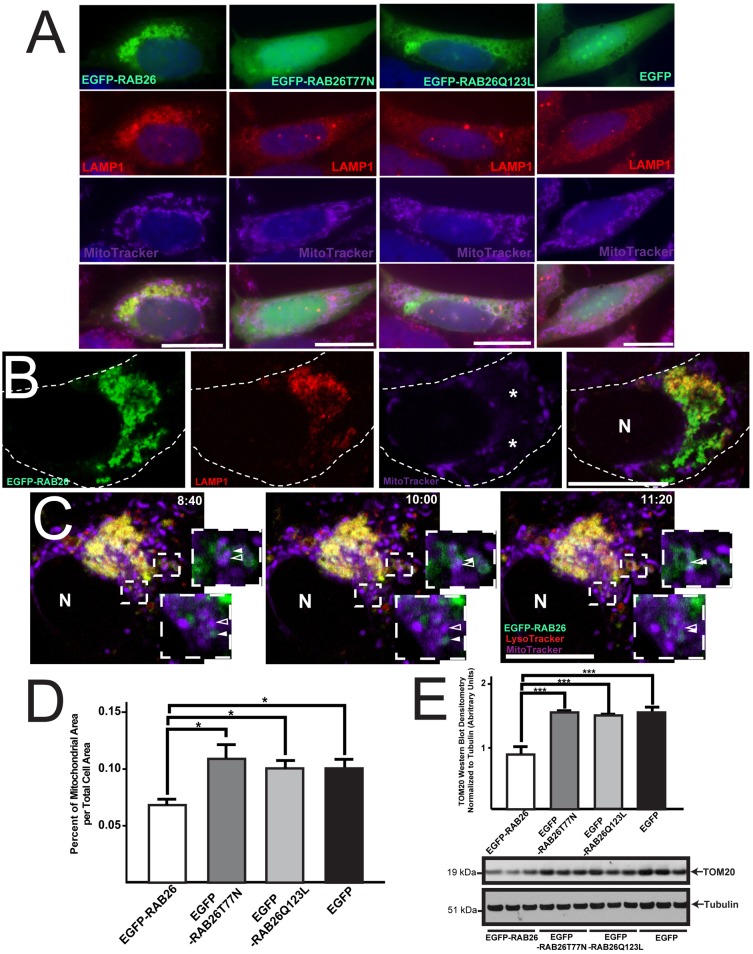
RAB26-induced lysosomal clustering leads to mitochondrial reorganization. (A) Fluorescence microscopy of HGC-27 cells transfected with EGFP–RAB26, EGFP–RAB26T77N, EGFP–RAB26Q123L and EGFP (green), co-stained for lysosomes (anti-LAMP1 antibody, red) and mitochondria (MitoTracker, purple). (B) Confocal section of EGFP–RAB26-expressing cell (green) stained for lysosomes (anti-LAMP1 antibody, red) and mitochondria (MitoTracker, purple). Perinuclear mitochondria free zones are indicated (*). The cell border is outlined; N, nucleus. (C) Live confocal timelapse microscopy of EGFP–RAB26 (green), LysoTracker-labeled lysosomes (red) and MitoTracker-labeled mitochondria (purple) vesicle dynamics. Insets highlight RAB26 (green, filled white arrowhead) and mitochondria (purple, open white arrowhead) interactions (time stamps of images from supplementary material Movie 2 are shown. N, nucleus. (D) Quantification of mitochondrial area over total cell area measured from multiple HGC-27 cells transfected with EGFP–RAB26, EGFP–RAB26T77N, EGFP–RAB26Q123L and EGFP. *P<0.05, one-way ANOVA test with Dunnett's correction. (E) Densitometry quantification of western blots (triplicate experiments) of mitochondrial membrane density using TOM20 and α/β tubulin markers for HGC-27 cells transfected with EGFP–RAB26, EGFP–RAB26T77N, EGFP–RAB26Q123L and EGFP. ***P<0.001, one-way ANOVA test with Dunnett's correction. Scale bars: 20 µm.

