
Figure 3. Phase matching.
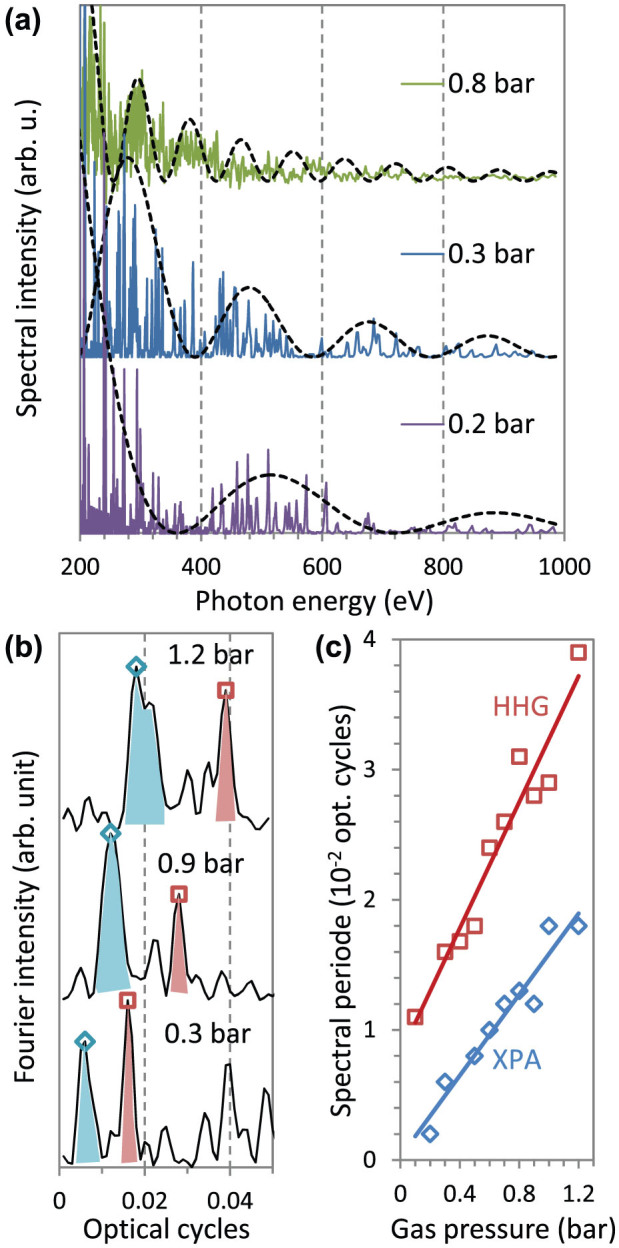
(a) In the measured spectra, long-period intensity modulations can be observed (black dashed lines) with pressure-dependent periods. This modulation is identified as a consequence of the non-phase-matched generation of the high harmonics. (b) The long-period modulations produce two distinct peaks in the Fourier transforms of the spectra at positions that depend on the gas pressure. (c) In accordance with the pressure dependence of the peak positions, an XPA contribution and a non-phase matched HHG contribution can be recognised in the generated spectra.