
Figure 4. STAT3 activation by KSHV correlates with an autophagy block in DCs.
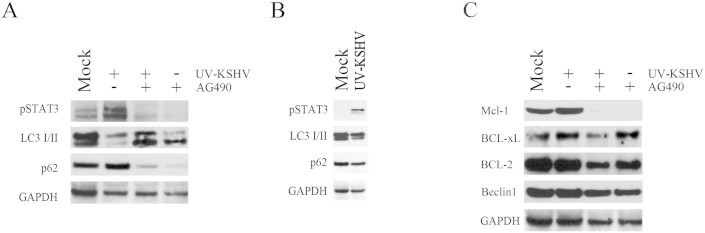
(A) Western blot analysis showing pSTAT3, LC3I/II and p62 expression level in DC mock or exposed to UV-KSHV for 15 min and cultured 24 hours in serum free conditions, in the presence or in the absence of STAT3 inhibitor AG490 (50 μg/ml). (B) Western blot analysis of pSTAT3, LC3I/II and p62 after 15 min of DC exposure to UV-KSHV (C) Western blot analysis of Mcl-1, BCL-xL, BCL-2 and Beclin1 expression in DCs mock or UV-KSHV-exposed, in the presence or in the absence of STAT3 inhibitor AG490 (50 μg/ml). GAPDH was included as protein loading control. 1 × 10⁶ overnight serum-starved DCs/point were used in all experiments. Data, representative of three independent experiments, are reported.