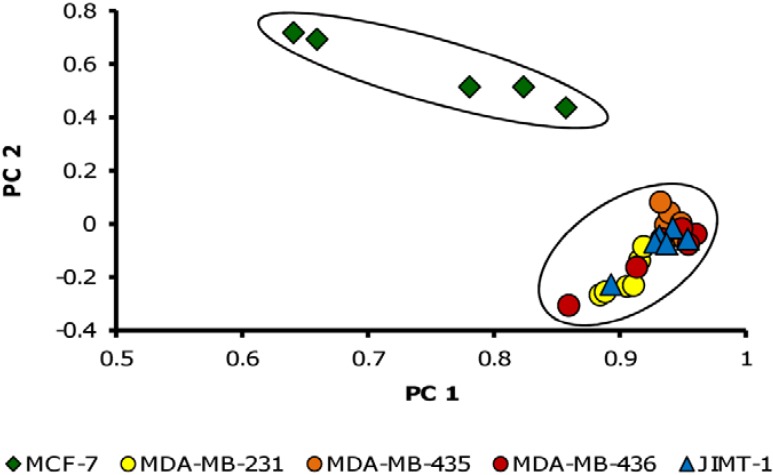
Figure 1.
Principal component analysis (PCA) of metabolite profiles from the five breast cancer cell lines. MCF-7 is clearly separated from the other cell lines. PC 1 includes 81% of variability, PC 2 7.5%. n = 6 for each cell line, only metabolites with significant differences between at least two cell lines (p < 0.05; mean ratio > 2) were included (n = 33).

