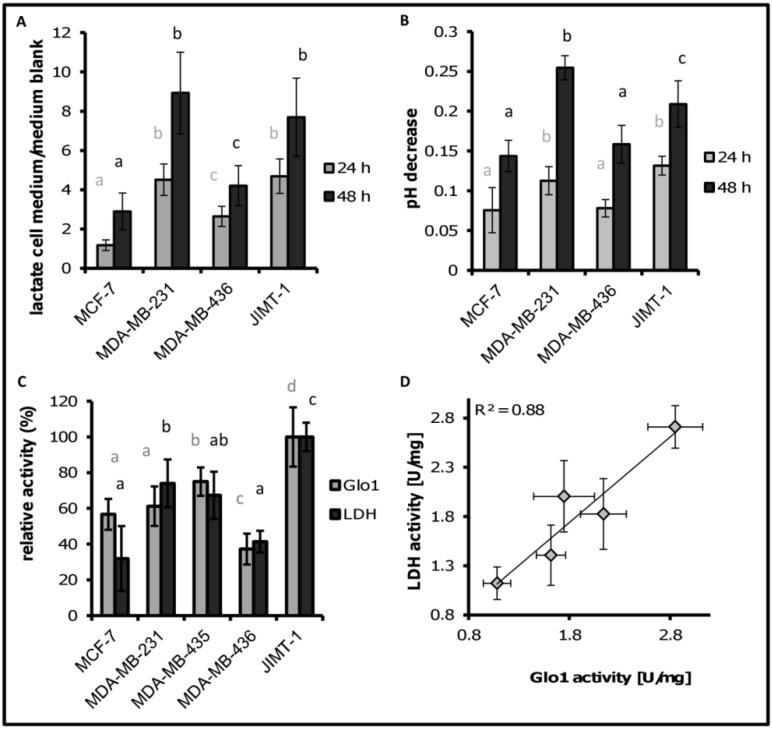
Figure 2.
(A) Lactate release for the cell lines. Signal ratios were calculated by dividing signals from medium samples with cells by the signal of medium blank measurements; (B) pH difference between medium blank and cultivation medium after 24 h and 48 h; (C) maximum normalized enzyme activities for LDH and Glo1 for the five cell lines; same letters indicate no significant difference, different letters = significant difference between cells with p < 0.05. n = 6 for lactic acid release, pH value and Glo1 activity, n = 4 for LDH activity; and (D) Correlation between LDH activity and Glo1 activity in cells.

