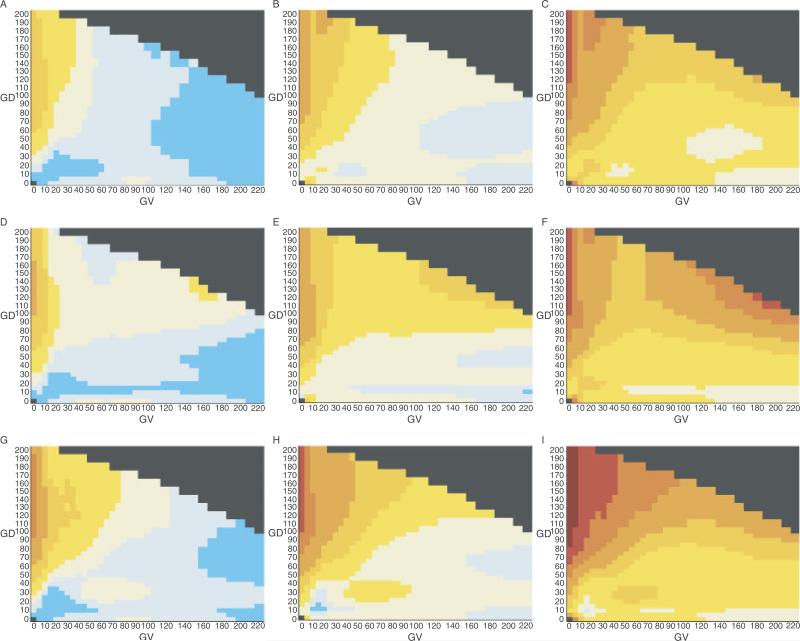
FIGURE 2.
Joint risk estimate heat maps and confidence intervals. Row 1: Heat maps based on the sequence alignment through frog; Row 2: heat maps based on the sequence alignment through puffer fish; Row 3: heat maps based on the sequence alignment through sea urchin; Column 1: 5th centile heat maps; Column 2: actual data heat maps; Column 3: 95th centile heat maps.

