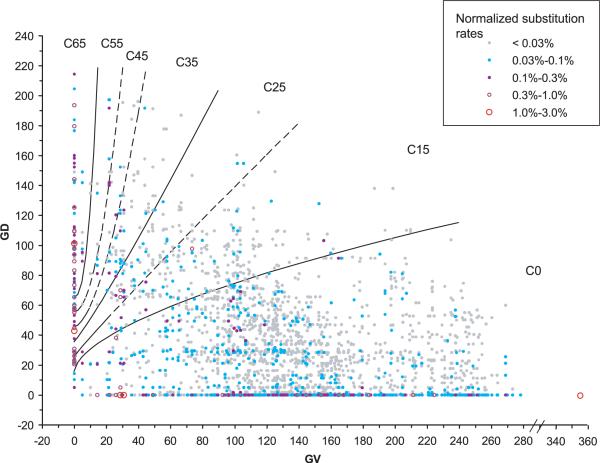
FIGURE 3.
Align-GVGD contour curves displayed with distributions of substitution probability. Each point or circle on the graph represents a coordinate in the GV-GD plane that is occupied by one or more of the possible missense substitutions that can result from a single-nucleotide substitution in the BRCA1 RING domain, BRCT domain, or BRCA2 DNA binding domain. Beyond values of GV and GD, each possible single-nucleotide substitution is associated with an underlying dinucleotide substitution rate constant [Lunter and Hein, 2004]. The color and size of the point or circle represent the rate constant. If two or more possible substitutions have exactly the same GV and GD coordinates, then their underlying dinucleotide substitution rate constants are added together to get the total rate constant for that coordinate.The color/size intensities of the substitution rate constant representations are normalized so that the total for the figure is 100%. Visual integration of the color/size intensities for substitution within a grade gives the proportion of all possible missense substitutions that are grouped in that grade.This particular graph displays the missense distribution obtained from the sequence alignment through sea urchin. The equations of the contour curves are: GD = 65+tan(10°) × (GV2.5); GD = 55+tan(10°) × (GV2.0); GD = 45+tan(15°) × (GV1.7); GD = 35+tan(50°) × (GV1.1); GD = 25+tan(55°) × (GV0.95); GD = 15+tan(75°) × (GV0.6).

