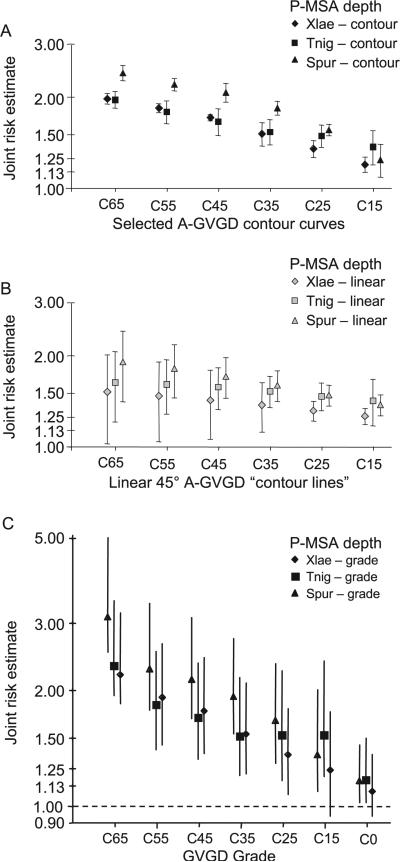
FIGURE 4.
Contour curve and grade risk estimates. A: Joint risk estimates averaged from 20 points spaced evenly along each selected contour curve at each of the three depths of alignment. Closed error bars give ±1 standard deviation from the joint risk estimate at the GD0 intercept. B: Joint risk estimates averaged from 20 evenly points spaced evenly along each linear 45° reference “contour line.” Closed error bars give ±1 standard deviation from the joint risk estimate at the GD0 intercept. C: Joint risk estimates averaged from 50 evenly spaced points within each grade. Open error bars give the 95th percentile confidence intervals, determined from 1,000 bootstrap samplings over the underlying data.

