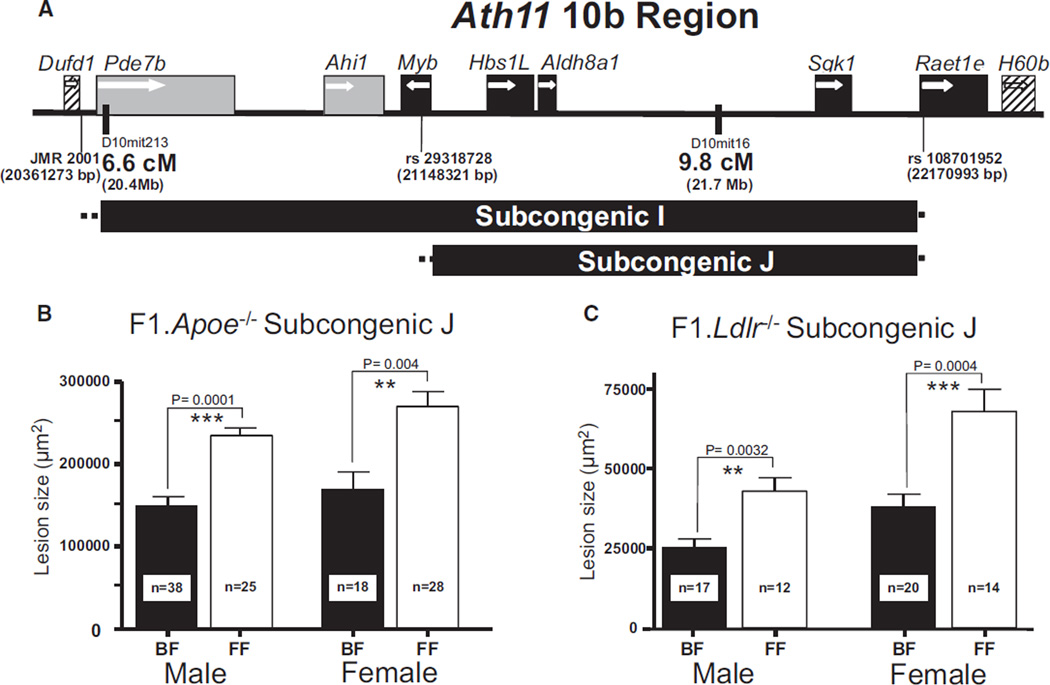
Figure 1. Subcongenic J narrows the Ath11 10b region.
A, Schematic illustration of the subcongenic strains I and J. The horizontal bar indicates the extent of the genomic interval for each subcongenic strain. The dotted lines at either side of the bar indicate the region in which the recombination occurred. Black boxes indicate genes contained in subcongenic J. Gray boxes denote genes contained in subcongenic I but not subcongenic J. Diagonally striped boxes indicate genes outside both subcongenics. White arrows indicate the transcriptional orientation of the genes, and coordinates are based on genome assembly GRCm38. B, Atherosclerotic lesion area of 16-week-old F1.Apoe−/− Chr10SubJ(B/F) (BF; black column) vs F1.Apoe−/− Chr10SubJ(F/F) (FF; white column) male and female mice. C, Atherosclerotic lesion area of 16-week-old F1.Ldlr−/− Chr10SubJ(B/F) (BF; black column) vs F1.Ldlr−/− Chr10SubJ(F/F) (FF; white column) male and female mice. The numbers of mice studied with each genotype are indicated at the bottom of their respective columns.

