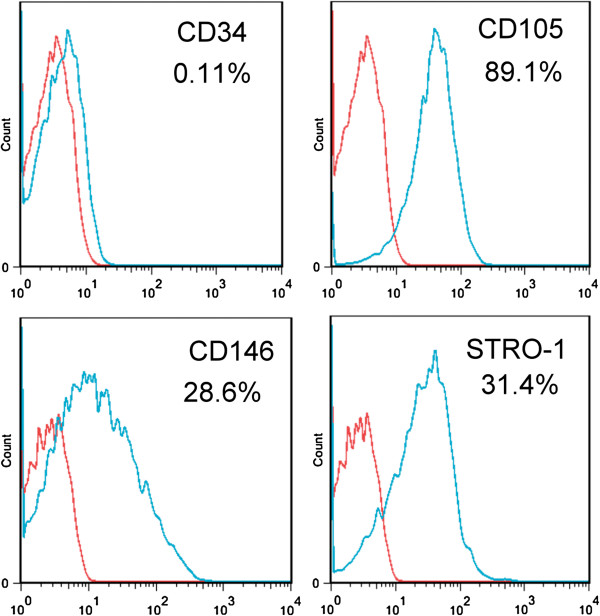
Figure 1.
Flow cytometry analysis of passage 1 cells from 1 patient. The percentage of cells expressing the MSC markers CD146, CD105, and Stro-1 and hematopoietic cell marker CD34 were shown. The blue line areas represent the distribution of cells stained by the respective antibodies; the red line areas are control cells without staining. Percentage numbers indicate the percentages of cells positively stained by the respective antibodies in the flow cytometry analysis.

