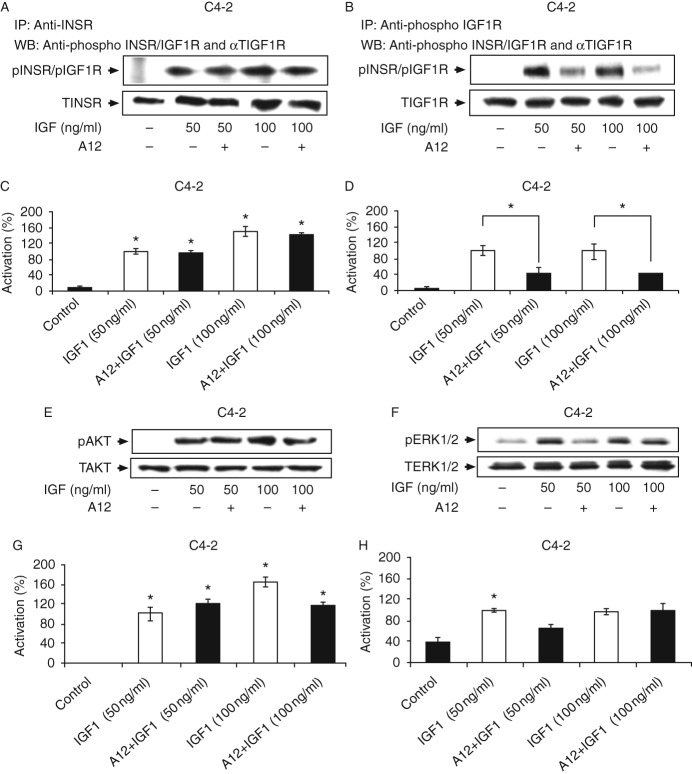
Figure 6.
Effect of cixutumumab (A12) on the IGF1-stimulated INSR, IGF1R, AKT, and ERK phosphorylations in C4-2 cells. (A and B) Effect of A12 on the IGF1-induced INSR and IGF1R phosphorylations. C4-2 cells were treated with A12 for 24 h, in the presence of IGF1 (50 or 100 ng/ml) during the last 10 min of incubation. At the end of the incubation period, the cells were lysed and immunoprecipitated with INSR (A) or IGF1R (B) antibodies, electrophoresed through SDS–PAGE, and immunoblotted with anti-phospho-IGF1R/INSR, anti-total INSR, or anti-total IGF1R. (C and D) Scanning densitometric analysis of phospho-INSR and phospho-IGF1R. Optical density is expressed as phospho-INSR (C) or phospho-IGF1R (D) values normalized to the corresponding total INSR or IGF1R levels. Bars represent means±s.e.m. of three independent experiments. *P<0.05 vs untreated cells (C) and *P<0.05 vs A12+IGF1-treated cells (D). (E and F) Effect of A12 on the IGF1-induced AKT and ERK1/2 phosphorylations. C4-2 cells were processed as described above, lysed, electrophoresed, and immunoblotted with anti-phospho-AKT (E) or phospho-ERK1/2 (F) and total AKT or total ERK1/2. (G and H) Scanning densitometric analysis of phospho-AKT and phospho-ERK1/2. Optical density is expressed as phospho-AKT (G) or phospho-ERK1/2 (H) values normalized to the corresponding total AKT or ERK1/2 levels. Bars represent means±s.e.m. of three independent experiments. *P<0.05 vs control cells (G) and *P<0.05 vs A12+IGF1-treated cells (H). Results of typical experiments, repeated three times with similar results, are shown in the figure.

 This work is licensed under a