
. 2014 Feb 28;3(1):24–35. doi: 10.1530/EC-13-0086
 This work is licensed under a
 Figure 8.
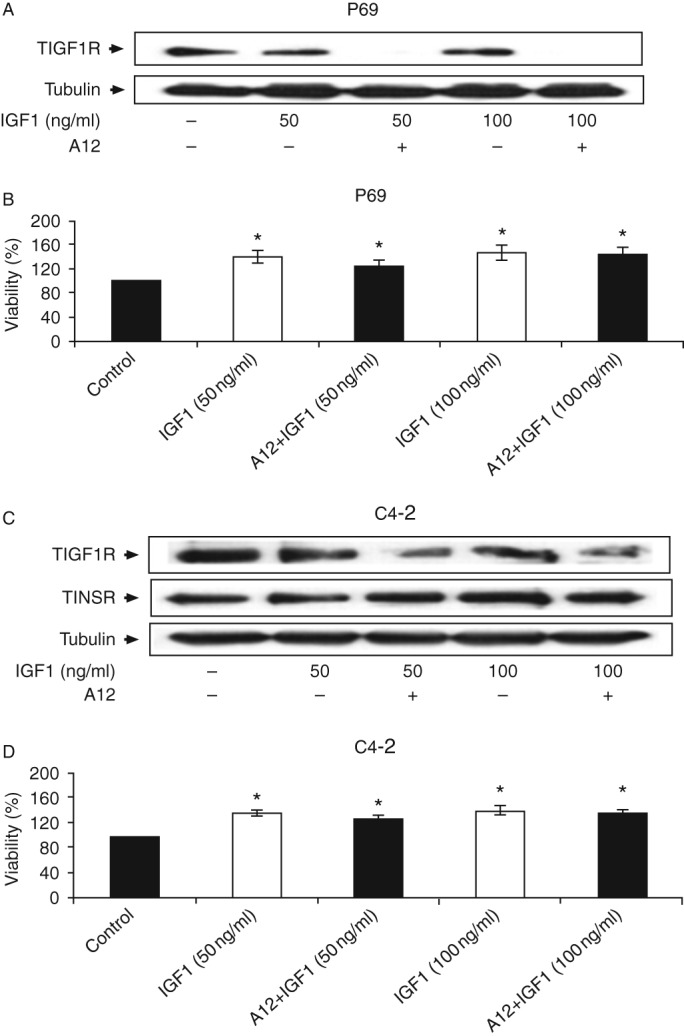
Effect of A12 on IGF1R levels. P69 and C4-2 cells were treated with the A12 antibody for 48 h in the presence or absence of IGF1. IGF1R levels were measured by western blot analysis (A and C). Effect of A12 on P69 and C4-2 cell proliferation. The cells were plated in 24-well plates at a density of 2×10⁴ cells/well for the P69 cell line (B) and 2×10⁴ cells/well for the C4-2 cell line (D). The cells were treated with IGF1 or IGF1 in combination with A12 for 48 h and the proliferation rates were measured by a MTT assay. The number of cells at time 0 was assigned a value of 100%. Bars represent means±s.e.m. of three independent experiments, each carried out in triplicate. *P≤0.05 vs control cells.