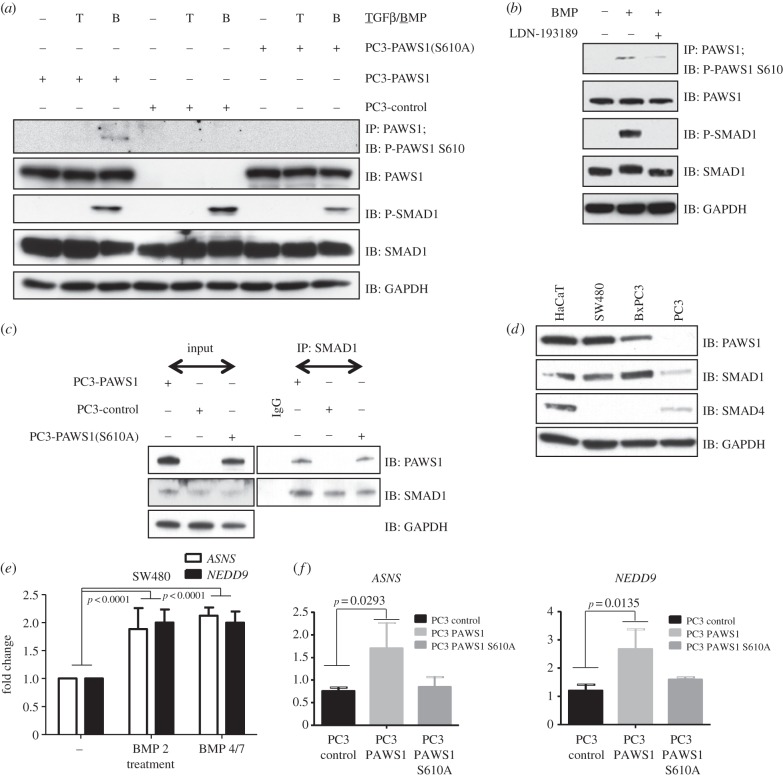
Figure 5.
The role of PAWS1 in the BMP pathway. (a) PC3-control, PC3-PAWS1 and PC3-PAWS1(S610A) cells were treated with either BMP-2 (25 ng ml−1), TGF-β (50 pmol) or left untreated for 1 h prior to lysis. PAWS1 was immunoprecipitated from cell extracts (1 mg protein) using anti-PAWS1 antibody. Anti-PAWS1 IPs and extract inputs (20 µg protein) were resolved by SDS–PAGE and immunoblotted with the indicated antibodies. (b) HaCaT cells were either left unstimulated or stimulated with BMP-2 (25 ng ml−1) or BMP-2 and LDN193189 (100 nM) for 1 h prior to lysis. PAWS1 was immunoprecipitated from cell extracts (1 mg protein) using anti-PAWS1 antibody. Anti-PAWS1 IPs and extract inputs (20 µg protein) were resolved by SDS–PAGE and immunoblotted with the indicated antibodies. (c) PC3-control, PC3-PAWS1 and PC3-PAWS1(S610A) cells were lysed and SMAD1 immunoprecipitated from extracts (1 mg protein) using anti-SMAD1 antibody. IP using pre-immune IgG was used as control from PC3-PAWS1 cell extracts (1 mg protein). SMAD1 IPs, IgG IP and extract inputs (20 µg protein) were resolved by SDS–PAGE and immunoblotted with the indicated antibodies. (d) Extract inputs (20 μg protein) from HaCaT, SW480, BxPC3 and PC3 cells were resolved by SDS–PAGE and analysed by immunoblotting using the indicated antibodies. (e) SW480 cells were either treated with BMP-2 (25 ng ml−1) and BMP-2/7 (10 ng ml−1 each) or left untreated for 6 h prior to RNA isolation. The relative expression of the indicated genes was analysed by qRT-PCR as described in the methods. The results show the fold change in gene expression relative to unstimulated controls. Data are represented as mean of three biological replicates and error bars indicate standard deviation (n = 3). (f) PC3-control, PC3-PAWS1 and PC3-PAWS1(S610A) cells were either treated with BMP-2 (25 ng ml−1) or left untreated for 6 h prior to RNA isolation. The relative expression of the indicated genes was analysed by qRT-PCR as described in §5. The results show the fold change in gene expression relative to unstimulated controls. Data are represented as mean of three biological replicates and error bars indicate standard deviation (n = 3).

