Figure 3.
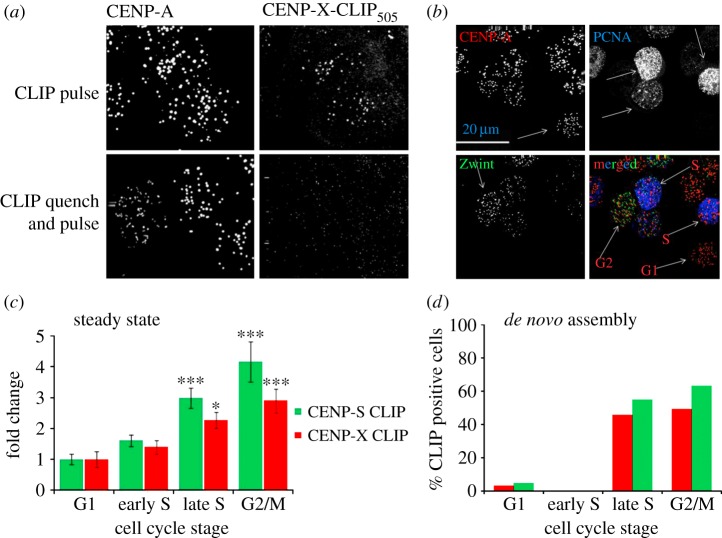
Analysis of CENP-S and CENP-X assembly during the cell cycle. (a) CENP-X-CLIP-expressing cells were labelled with CLIP-505 and co-detected with CENP-A by immunofluorescence (top). Pre-treatment of cells with CLIP-BLOCK prevented subsequent labelling with CLIP-505 (bottom). (b) Cells were stained with antibodies against PCNA (blue) and Zwint (green) to allow identification of centromeres (CENP-A, red) in defined cell-cycle stages. (c) Cells were labelled with CLIP-505 to report steady-state levels of protein and cells were simultaneously stained for cell-cycle classification. Intensity of CLIP-505 is presented as the mean and the standard error of the mean in each of four cell-cycle stages: G1, early S, late S and G2/M. One way analysis of variance (ANOVA) followed by a Dunnett's multiple comparison test was used to analyse the statistical significance of increase in signal intensity relative to G1; *p ≤ 0.01, ***p ≤ 0.001. (d) CENP-CLIP fusion proteins were blocked and allowed to recover for 8 h prior to labelling with CLIP-505. They were simultaneously labelled for cell-cycle analysis and the percentage of cells in the population positive for CLIP-505 staining is shown versus cell-cycle stage.

