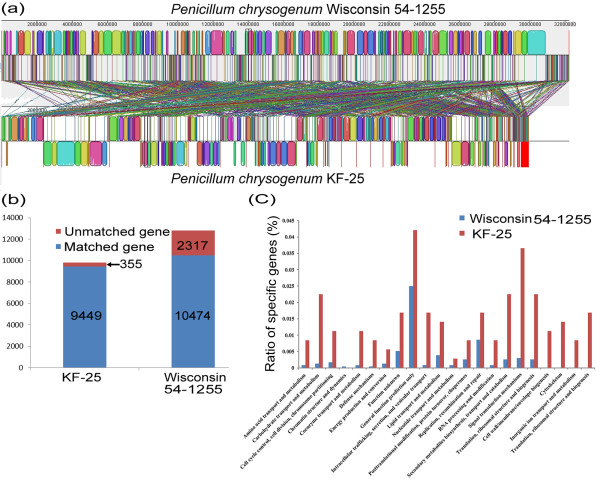
Figure 3.
Comparative genome analysis of P. chrysogenum KF-25 and Wisconsin 54-1255. (a) Alignment of the KF-25 and Wisconsin 54-1255 genomes using Mauve 2.3.1. The line above indicates the position of the genome in Wisconsin 54-1255. The rectangles represent the genome fragments and the white gaps between the rectangles mean no similar fragments were found in the other genome. (b) Comparation of the orthologous genes between the genomes of P. chrysogneom KF-25 and Wisconsin 54-1255. Numbers of genes with orthologs found in the other genome are represented in blue and numbers of genes with no ortholog genes found were represented in red. The vertical axis indicates the number of genes. (c) KOG classification of the specific genes of KF-25 and Wisconsin 54-1255. The vertical axis indicates the percentage of genes among the specific genes (2,317 specific genes for Wisconsin 54-1255 and 355 specific genes for KF-25) and the horizontal axis indicates the classification of the gene in the KOG database.

