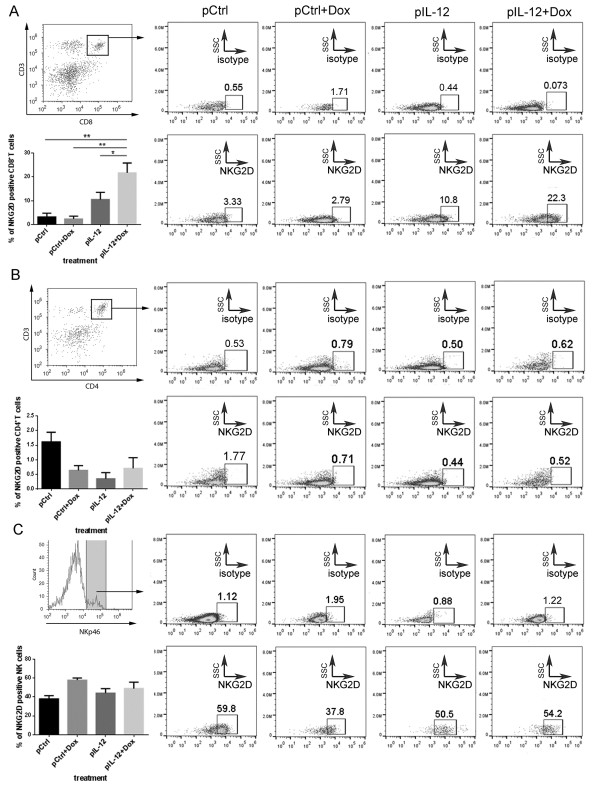
Figure 1.
CD8+T cell–specific induction of NKG2D by co-administration of Dox and IL-12. Groups of tumor-bearing BALB/C mice were subjected to one of four standard treatments: control DNA (pCtrl), Dox plus control DNA (pCtrl + Dox), IL-12 (pIL-12), or Dox plus IL-12 (Dox + pIL-12) (n = 3 per treatment group). NKG2D expression was determined in CD8+T cells (A), CD4+T cells (B), and NK cells (C). (A, B) To measure NKG2D expression in CD8+T cells and CD4+T cells, splenocytes were stained with PE-Cy7 anti-mouse -NKG2D, PE anti-mouse CD3ϵ, and FITC anti-mouse CD8 or CD4 antibody or cognate isotype control antibody for detection of T cells, CD8+T cells, and CD4+T cells, respectively. CD3/CD8– or CD3/CD4–positive lymphocytes were gated with use of flow cytometry and then were further analyzed to determine their levels of NKG2D expression. (C) To measure NKG2D expression in NK cells, splenocytes were stained with PE-Cy7 anti-mouse NKG2D and FITC anti-mouse NKp46 or with corresponding isotype control antibody. NKp46-positive lymphocytes were selected by flow cytometry and then analyzed to identify NKG2D-positive cells. All of the bar graphs represent the percentage of NKG2D receptor–positive cell population, as mean ± SEM (n = 3; *P < 0.05, **P < 0.01, ***P < 0.001).

