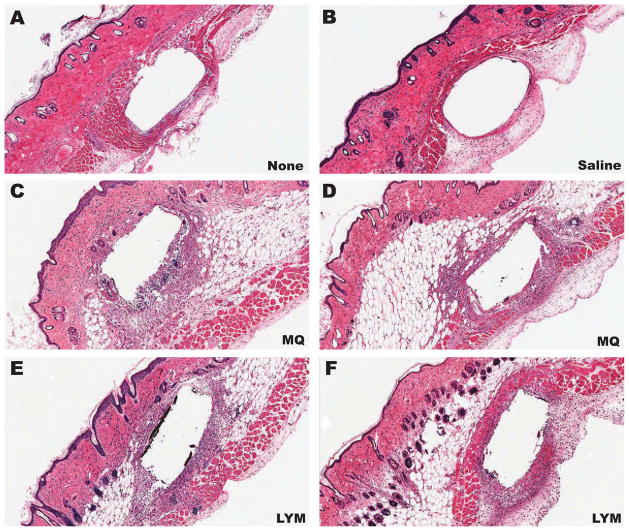
Figure 7. Histopathology of glucose sensor implantation sites injected with macrophage or lymphocyte.
Presented in Figure 7 are representative photomicrographs of histopathology (H&E) of glucose sensor implantation sites including: non-injected (A), saline injected (B), macrophage (MQ) injected (C, D) and lymphocyte (LYM) injected (E, F).

