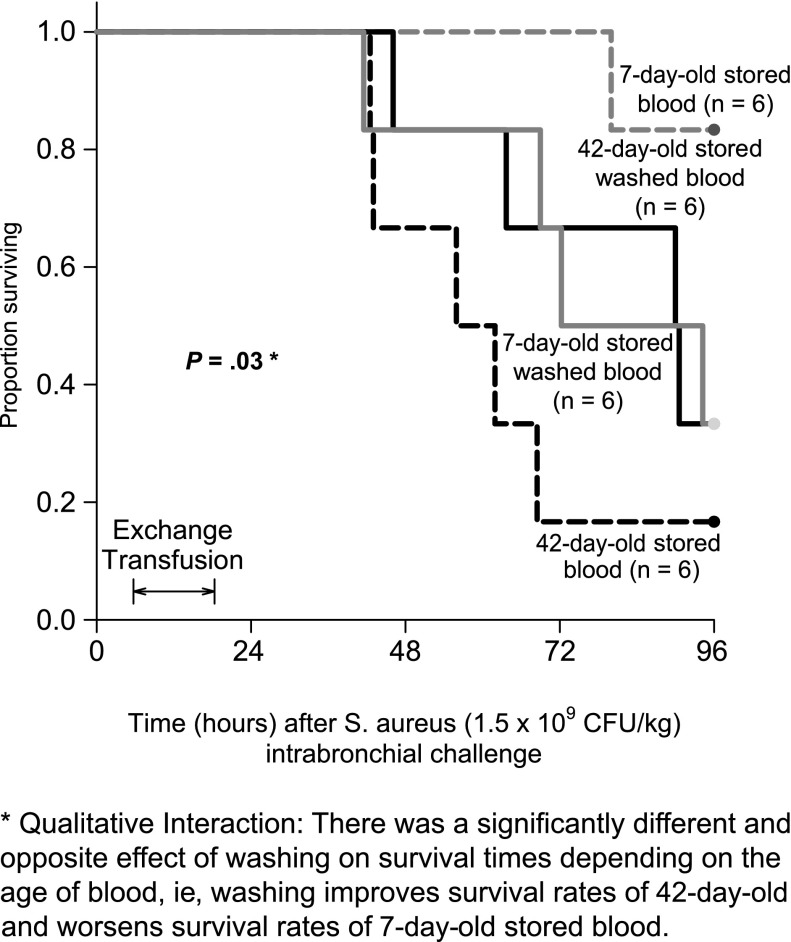
Figure 1.
Survival curves. Kaplan-Meier plots throughout the 96-hour study comparing the 4 types of transfused blood are represented. The different types of blood are represented by different line patterns as follows: dashed black line (42-day-old unwashed blood), solid black line (42-day-old washed blood), solid gray line (7-day-old washed blood), and dashed gray line (7-day-old unwashed blood). There is a qualitative interaction between washing and the age of stored blood (P = .03).

