
Figure 2. Distribution of C/(C+T) ratios for cytosines within the CpG context in the H1 cell line.
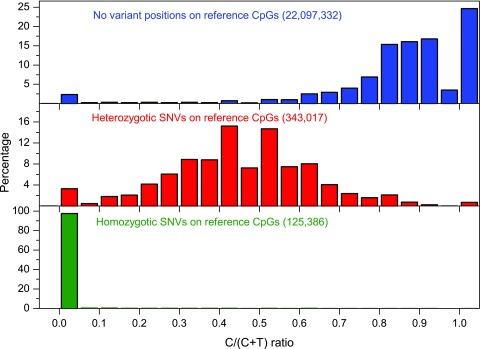
C/(C+T) values for cytosines at non-variant and variant (homo- and heterozygotic) positions were shown. The minimum read coverage was set to 10 reads.
Official websites use .gov
A
.gov website belongs to an official
government organization in the United States.
Secure .gov websites use HTTPS
A lock (
) or https:// means you've safely
connected to the .gov website. Share sensitive
information only on official, secure websites.
C/(C+T) values for cytosines at non-variant and variant (homo- and heterozygotic) positions were shown. The minimum read coverage was set to 10 reads.