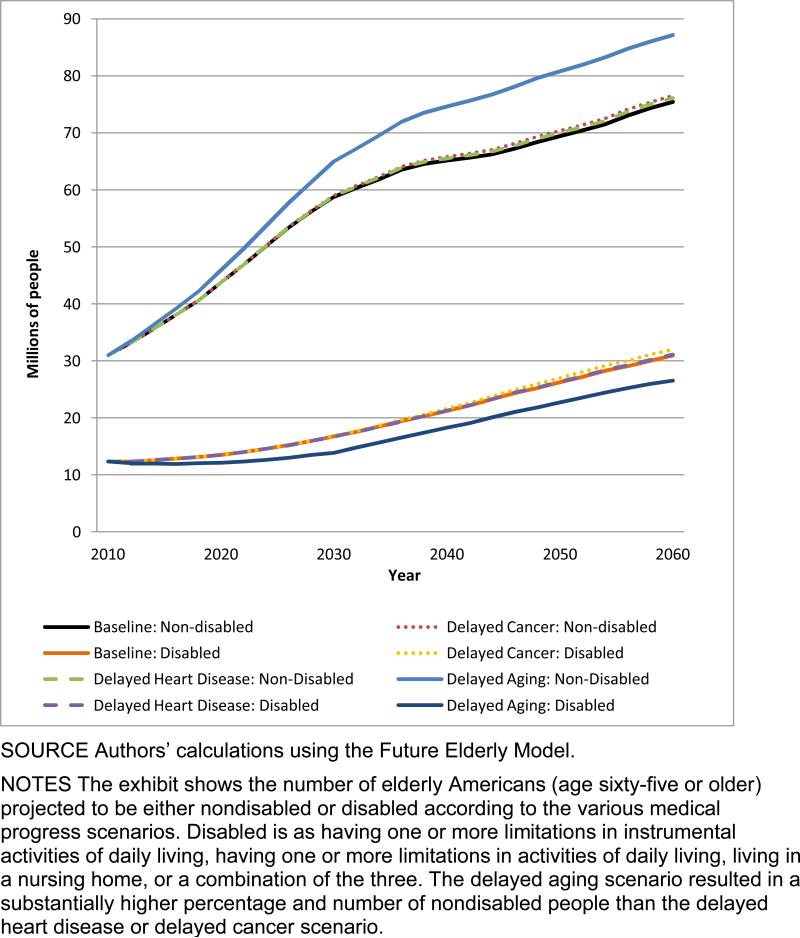
EXHIBIT 1. Millions Of Nondisabled And Disabled Elderly Americans In Various Scenarios, 2010–60.
SOURCE Authors’ calculations using the Future Elderly Model.
NOTES The exhibit shows the number of elderly Americans (age sixty-five or older) projected to be either nondisabled or disabled according to the various medical progress scenarios. Disabled is as having one or more limitations in instrumental activities of daily living, having one or more limitations in activities of daily living, living in a nursing home, or a combination of the three. The delayed aging scenario resulted in a substantially higher percentage and number of nondisabled people than the delayed heart disease or delayed cancer scenario.

