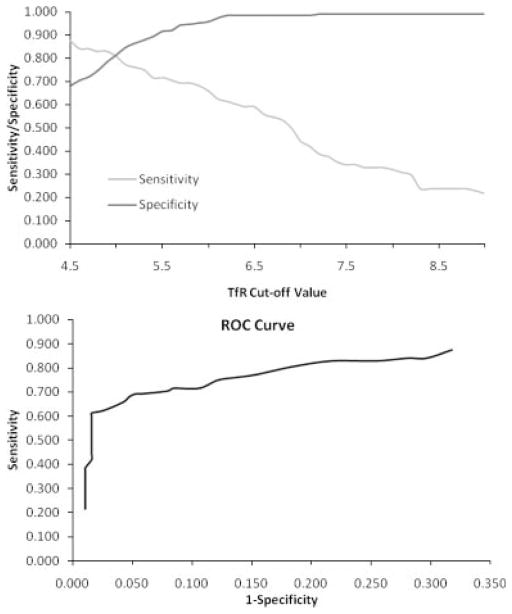
Fig. 1.
Sensitivity, specificity, and ROC curve for TfR. Above: Sensitivity (fraction of true positives exceeding the cut off) and specificity (fraction of true negatives falling below the cut off) of transferrin receptor (TfR) for identifying iron deficiency, as defined by elevated zinc protoporphyrin to heme ratio (ZPP:H > 80 μmol/mol). Below: Receiver operating characteristic (ROC) curve (across the range of reasonable cut offs) for transferrin receptor (TfR) in identifying iron deficiency, as defined by elevated zinc protoporphyrin to heme ratio.

