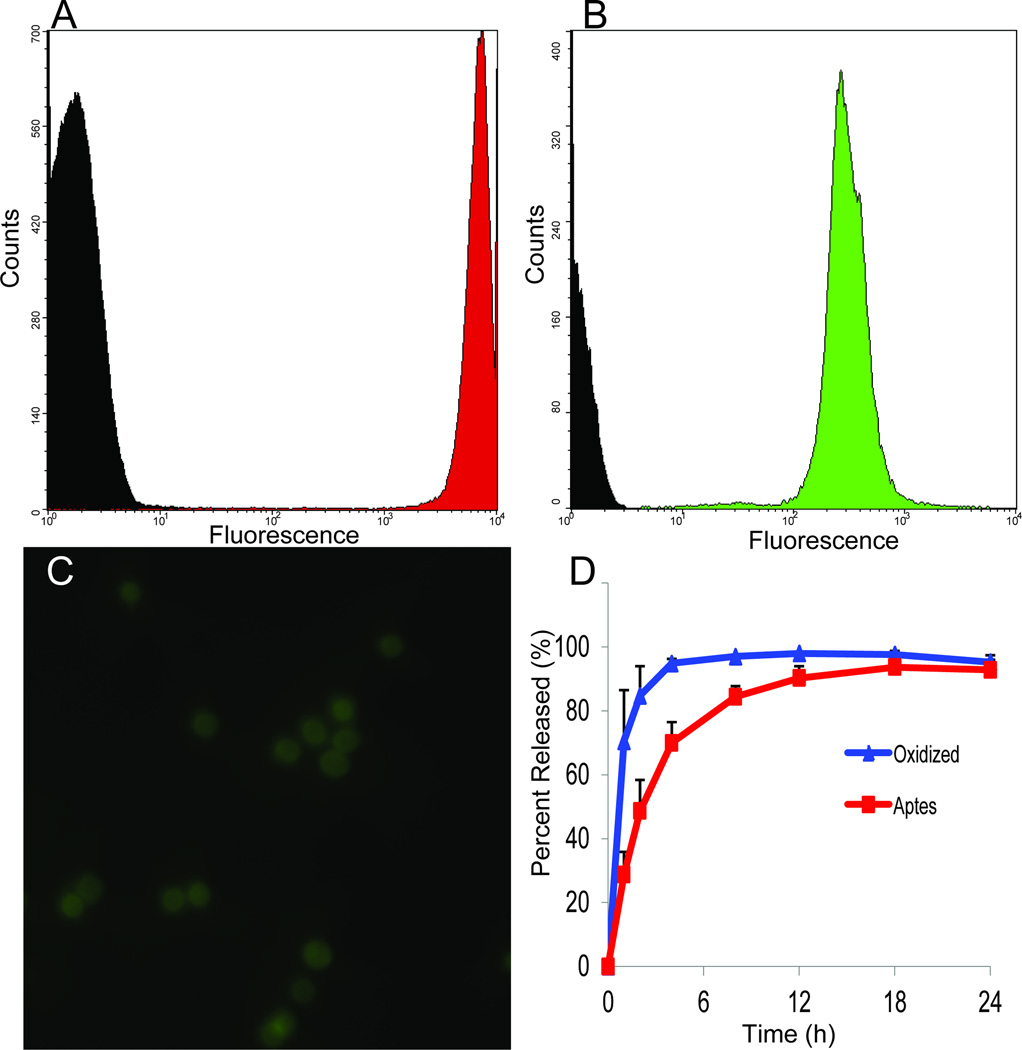
Figure 4. Loading and release of nanoparticles from MSN.
A–C. Loading of NP (liposomes, quantum dots) into MSN. A,B. Flow cytometry of loading comparing the fluorescence of MSN, either unloaded (black) or with NP-loaded (A, green, liposomes; C, red, quantum dots). C. Fluorescent image of MSN containing FITC labeled nanoliposomes. D. Release profiles of quantum dots from oxidized (blue) and APTES modified (red) MSN.

