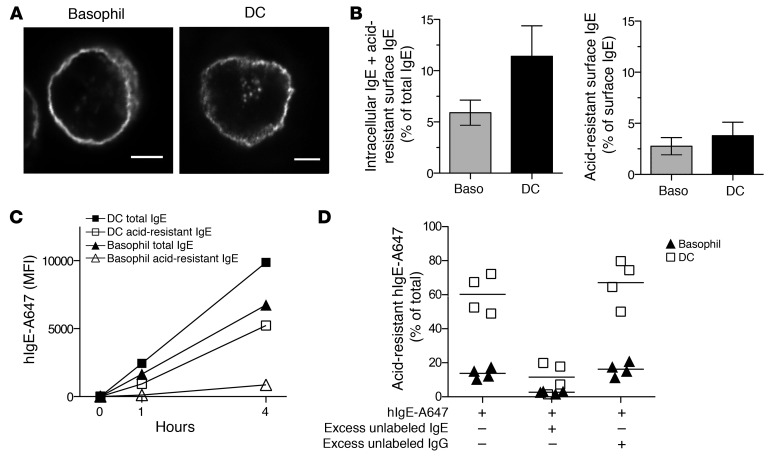
Figure 3. IgE bound to FcεRI on DCs is efficiently internalized.
(A) Intracellular IgE in basophils and DCs. The basophil image is representative of 83 recorded images from 7 unique and representative donors, and the DC image is representative of 121 recorded images from 9 unique and representative donors. Original magnification, ×60 and scale bars are 2.5 μm. (B) Intracellular IgE was quantified by flow cytometry. Isolated basophils and DCs were washed with acid (see Methods for detail) or PBS. Data are mean ± SEM for 8 representative donors. (C) Entry of hIgE-A647 into basophils and DCs of one representative donor. hIgE-A647 (0.5 μg/ml) was added to PBMCs. At each indicated time point, cells were treated with acid or PBS before permeabilization and analysis by flow cytometry. (D) IgE entry to basophils and DCs is IgE receptor mediated. PBMCs were incubated for 4 hours with hIgE-A647 (0.5 μg/ml) alone (left), with excess unlabeled IgE (middle), or IgG (40 μg/ml) (right). Cells incubated with hIgE-A647 alone were washed with acid or unwashed. Cells incubated together with excess IgE or IgG were all washed with acid. Then, the A647 MFI of acid-washed cells was divided by that of unwashed cells to comparatively determine intracellular IgE content. Data are mean ± SEM for 4 representative donors.

