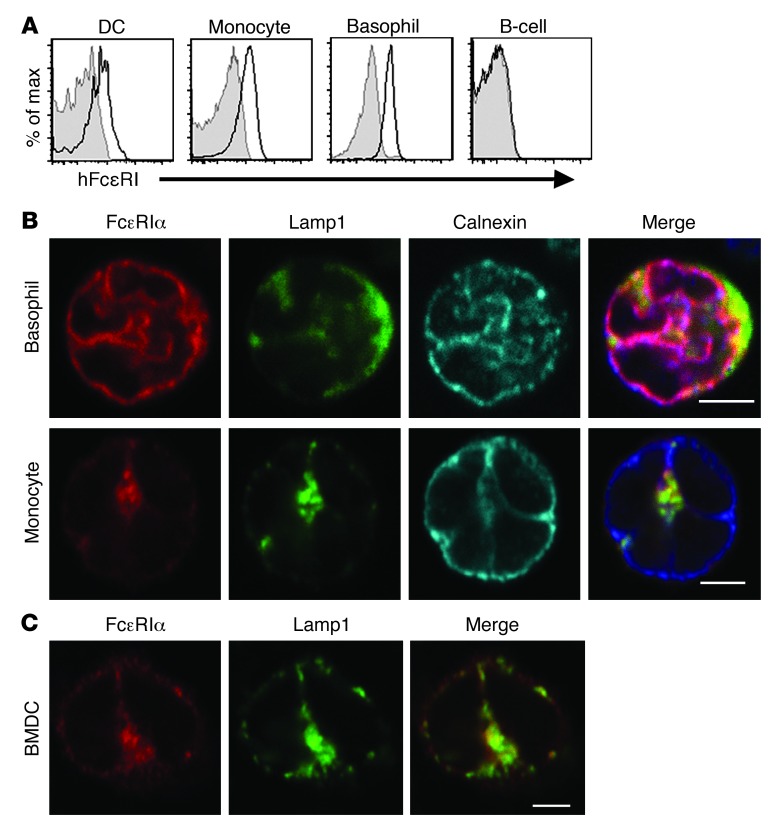
Figure 5. FCER1A-Tg mice express and localize hFcεRI in a similar manner to humans.
(A) Surface expression of hFcεRI in FCER1A-Tg mouse blood leukocytes. Blood from adult hFcεRIα(+) transgenic (Tg+, black) and hFcεRIα(–) (Tg–, gray shaded) littermates was collected and stained with an anti-hFcεRIα antibody and cell type–specific antibodies after red blood cell lysis. Gating strategies are shown in Supplemental Figure 6A. (B) Intracellular localization of hFcεRI in Tg+ mouse blood basophils and monocytes. Sorted blood basophils and monocytes were stained for confocal microscopy as described for Figure 2. Images are representative of results from 3 independent experiments. Note that the calnexin signal has been switched from blue to cyan for ease of visualization in single-stain format, while it has not been altered for merged images. (C) Intracellular localization of hFcεRI in Tg+ mouse CD11b+ BMDCs. BMDCs were cultured using Flt3L, sorted for CD11b+ cDCs as described for Supplemental Figure 6B, and stained as in B. Images are representative results from 3 independent experiments. For all confocal images, magnification was ×60, scale bars are 2.5 μm, and negligible staining by isotype control antibodies was confirmed (Supplemental Figure 7).

