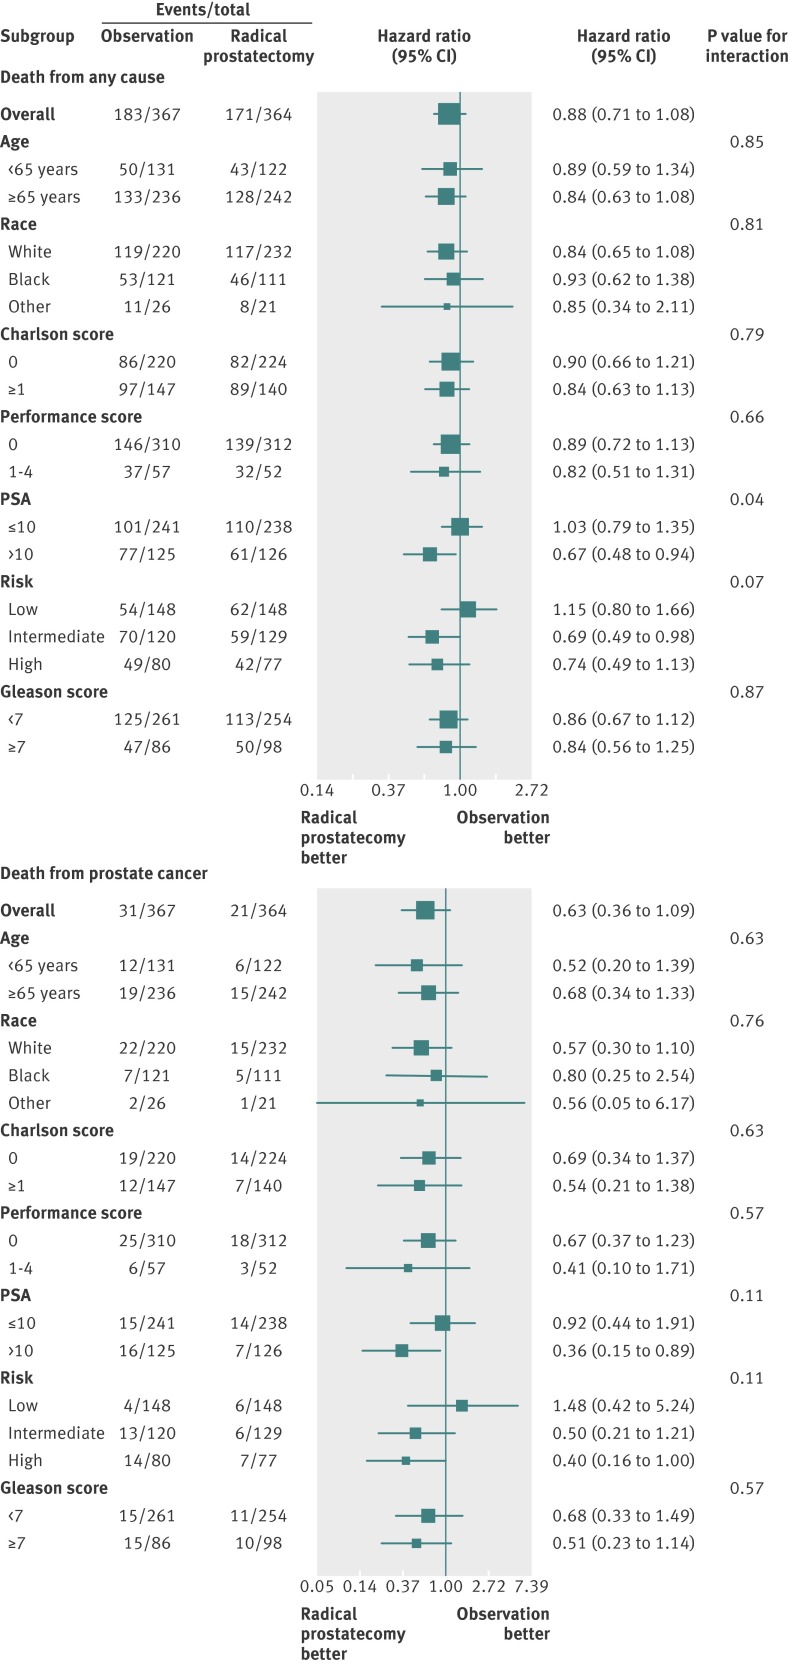
Fig 5 Forest plots demonstrating subgroup effects (hazard ratio with 95% confidence intervals and P value for interaction) in the Prostate Cancer Intervention versus Observation Trial (PIVOT) comparing radical prostatectomy with observation. The vertical line indicates no effect. The size of the boxes indicates the weight of the effects24

An official website of the United States government
Here's how you know
Official websites use .gov
A
.gov website belongs to an official
government organization in the United States.
Secure .gov websites use HTTPS
A lock (
) or https:// means you've safely
connected to the .gov website. Share sensitive
information only on official, secure websites.
