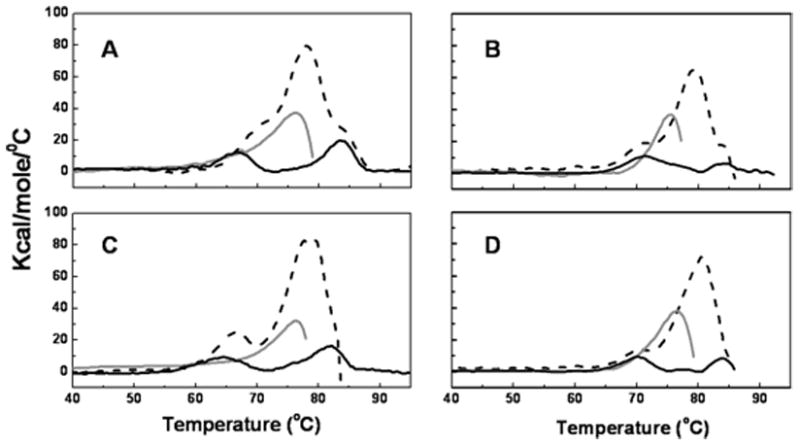
Figure 4.

Differential Scanning Calorimetry (DSC) of the mAb at pH 6. Dashed black lines correspond to the full-length mAb, solid gray lines correspond to the Fab fragment of the mAb and the solid black lines correspond to the Fc fragment of the mAb. Panel A corresponds to the 10 mM histidine formulation. Panel B corresponds to the 10 mM sodium phosphate formulation. Panel C represents the 10 mM histidine, 150 mM NaCl formulation. Panel D represents the 10 mM sodium phosphate, 150 mM NaCl formulation.
