Fig. 4.
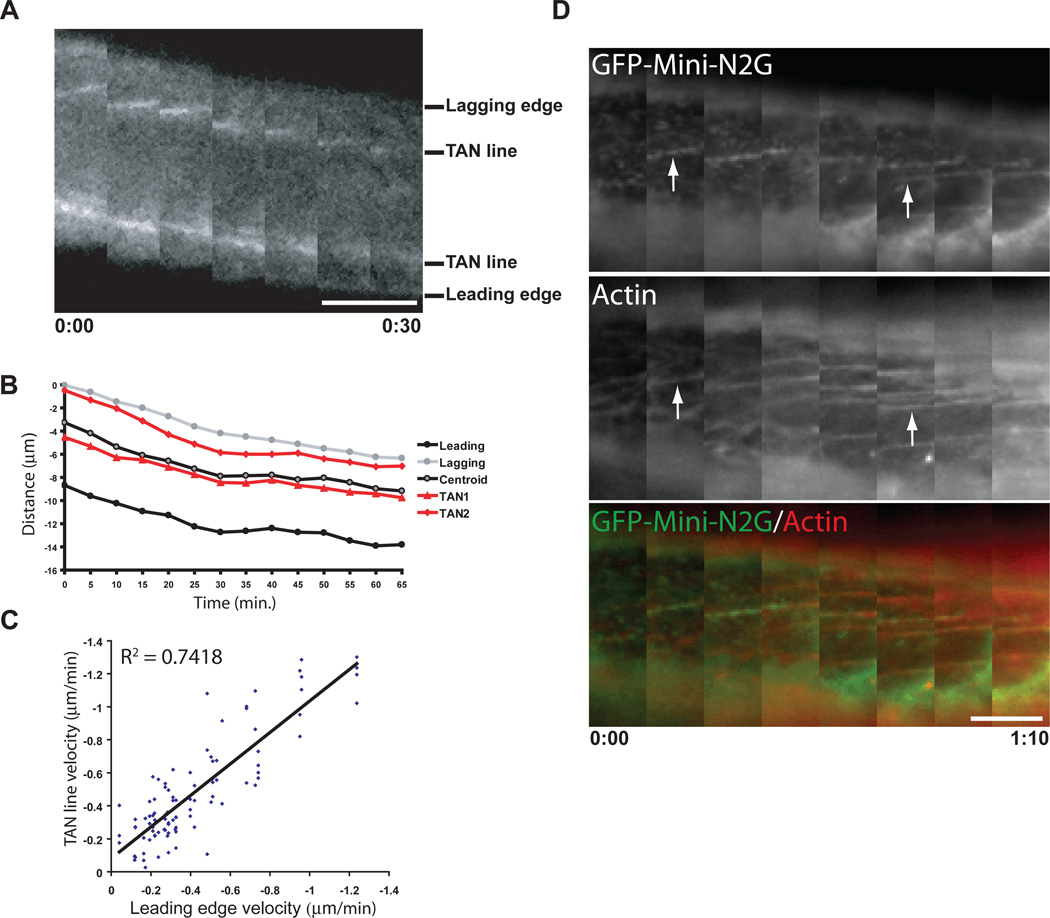
TAN lines are coupled with dorsal actin cables during nuclear movement. A, Fluorescence kymograph of GFP-mini-N2G TAN lines in a nucleus from a nesprin2-depleted cell from movie 6. The leading and lagging edges of the nucleus and two TAN lines are indicated. Each image is 5 min. B, Representative distance versus time plot of TAN lines, nuclear centroid, and leading and lagging nuclear edges from a movie of a cell treated as in A. C, Comparison of GFP-mini-N2G TAN line and leading nuclear edge velocities in cells treated as in A. Data are from 30 movies of 30 cells. R2 is the coefficient of determination. D, Fluorescence kymograph of GFP-miniN2G and Lifeact-mCherry on the dorsal nuclear surface of a nucleus in a cell treated as in A from movie 7. Arrows indicate examples of TAN lines forming on actin cables. Panels are every 10 min and oriented with the wound-edge at the top. Time is hour:min for A and D. Scale bars in A and D, 5 µm.

