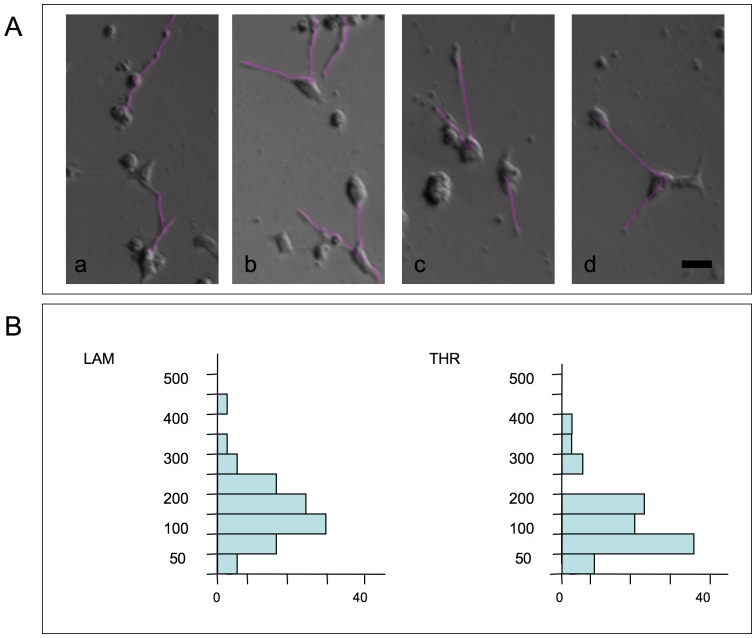
Figure 3. Video time laps analysis of SSP-mediated neurite-like outgrowth of SCLC cells on ECM constituents.
12h-lasting time laps analyses of GLC-2 cells cultured at low density on LAM or THR surfaces in the presence of 50 nM SSP. Tracing of neurite-like extensions was accomplished with Image J software. 80 or 86 cells were analyzed for LAM or THR substrates, respectively. A: Selected micrographs of process-bearing GLC-2 cells on LAM (a, b) or THR substrata (c, d). Purple lines indicate traced neurite-like extensions. Bar in d: 20 µm. B: Graphs show the sum of total neurite-like process lengths from individual cells for the 12 h period. Distances plotted on the y-axis are split into 50 µm bins and the number of the sums of total neurite-like process lengths (per individual cell) for each category (in percent) is given on the x-axis.

