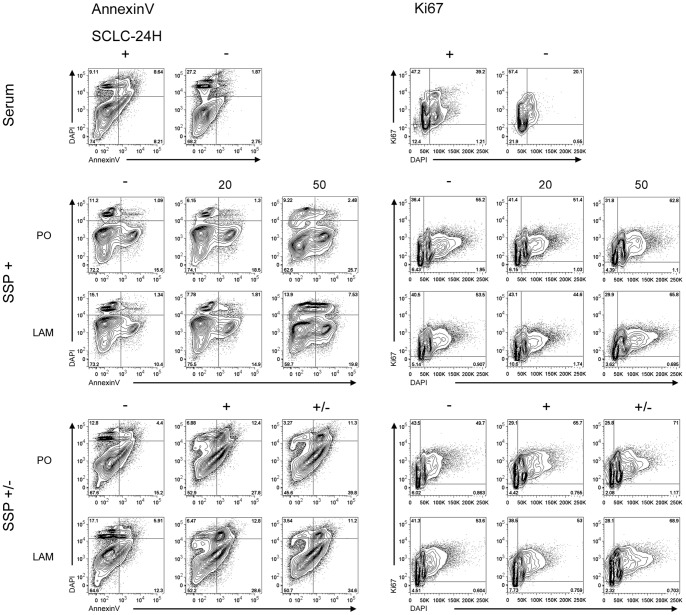
Figure 10. Cell cycle analysis of SCLC-24H cells.
Cells were either cultured in the absence or presence of serum (Serum); treated for 24 h without (−) or with different SSP concentrations (20, 50 nM) (SSP+); or treated without SSP for 48 h (−) or with 50 nM SSP for 24 h (SSP +/−) and then analyzed immediately (+) or cultured for further 24 h in the absence of the drug (+/−). Representative FACS plots of cell viability (Annexin V; left panels) and cell cycle progression (Ki67; right panels) under different treatment conditions are shown.

